Supported by Dr. Osamu Ogasawara and  . . |
|
Last data update: 2014.03.03 |
Rodent bronchial carcinoma dataDescriptionIn a long term rodent carcinogenicity study on female B6C3F1 mice, the effect of vinylcyclohexene diepoxide on the incidence of murine alveolar/bronchiolar tumors was assessed. The mice were exposed to 0 mg/ml, (group 0), 25 mg/ml (group 1), 50 mg/ml (group 2), and 100 (group 3) mg/ml, with 50 animals per group. Usagedata(bronch) FormatA data frame with 200 observations on the following 3 variables.
DetailsNot yet checked for consistency with the source! SourcePiegorsch WW and Bailer AJ (1997): Statistics for environmental biology and toxicology. Chapman and Hall, London. Table 6.5, page 238. ReferencesPortier cJ and Bailer AJ (1989): Testing for increased carcinogenicity using survival-adjusted quantal response tests. Fundamental and Applied Toxicology 12, 731. Examples
data(bronch)
# raw tumour counts:
table(bronch[c("group","Y")])
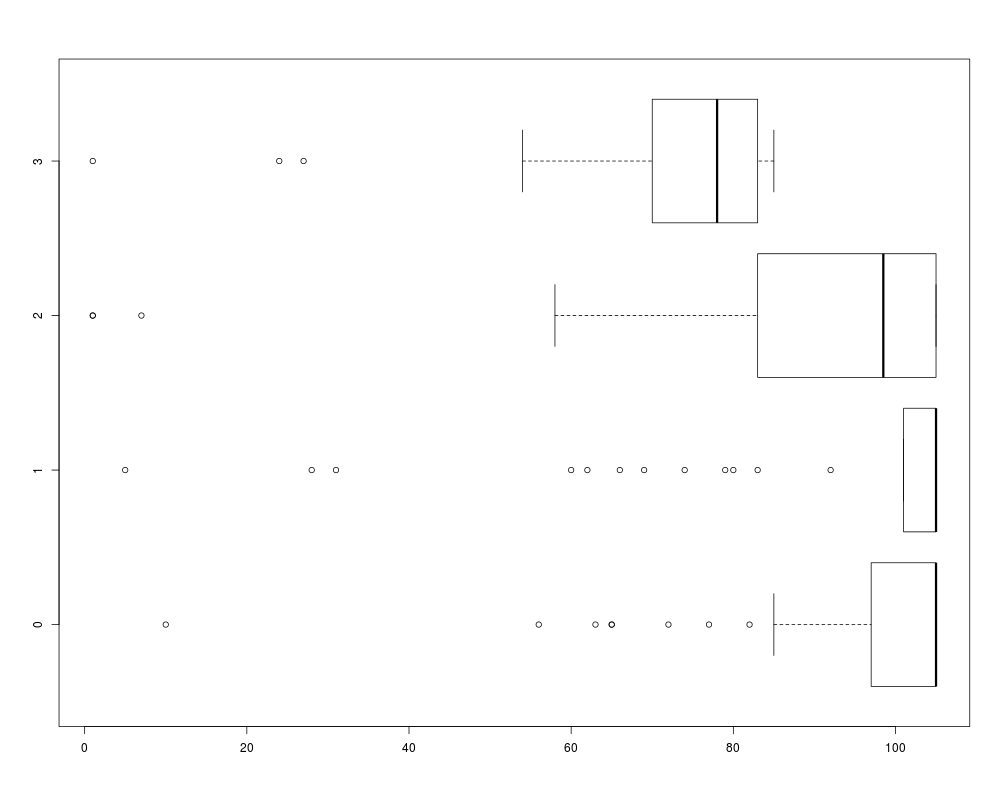
# groupwise times of death:
boxplot(time ~ group, data=bronch, horizontal=TRUE)
# Using poly3estf, we can produce the
# summary statistics as presented in
# Table 6.6, page 239, of Piegorsch and Bailer (1997):
poly3estf(status=bronch$Y, time=bronch$time, f=bronch$group)
Results
R version 3.3.1 (2016-06-21) -- "Bug in Your Hair"
Copyright (C) 2016 The R Foundation for Statistical Computing
Platform: x86_64-pc-linux-gnu (64-bit)

R is free software and comes with ABSOLUTELY NO WARRANTY.
You are welcome to redistribute it under certain conditions.
Type 'license()' or 'licence()' for distribution details.

R is a collaborative project with many contributors.
Type 'contributors()' for more information and
'citation()' on how to cite R or R packages in publications.

Type 'demo()' for some demos, 'help()' for on-line help, or
'help.start()' for an HTML browser interface to help.
Type 'q()' to quit R.

> library(MCPAN)
> png(filename="/home/ddbj/snapshot/RGM3/R_CC/result/MCPAN/bronch.Rd_%03d_medium.png", width=480, height=480)
> ### Name: bronch
> ### Title: Rodent bronchial carcinoma data
> ### Aliases: bronch
> ### Keywords: datasets
>
> ### ** Examples
>
> data(bronch)
> # raw tumour counts:
>
> table(bronch[c("group","Y")])
     Y
group FALSE TRUE
    0    46    4
    1    41    9
    2    39   11
    3    43    7
>
> # groupwise times of death:
>
> boxplot(time ~ group, data=bronch, horizontal=TRUE)
>
> # Using poly3estf, we can produce the
> # summary statistics as presented in
> # Table 6.6, page 239, of Piegorsch and Bailer (1997):
>
> poly3estf(status=bronch$Y, time=bronch$time, f=bronch$group)
Raw and poly-3-adjusted sample estimates:
                        0       1       2       3
x                  4.0000  9.0000 11.0000  7.0000
n                 50.0000 50.0000 50.0000 50.0000
adjusted n        41.8368 40.9661 38.4904 22.8135
adjusted estimate  0.0956  0.2197  0.2858  0.3068

>
>
>
>
>
>
>
> dev.off()
null device
          1
>
|