Supported by Dr. Osamu Ogasawara and  . . |
|
Last data update: 2014.03.03 |
Marked improvement of psoriasis after application of liarozoleDescriptionIn a placebo controlled clinical trial, patients with psoriasis were randomly assigned to a placebo group and three dose groups (50 mg, 75 mg, and 150 mg). Variable of primary interest was the proportion of patients with marked improvement of psoriasis. This data.frame mimics how raw data could have been represented in a larger data frame. Usagedata(liarozole) FormatA data frame with 137 observations on the following 2 variables.
DetailsFor illustrative purpose only. Number of successes recalculated from proportions presented in the publication, while the number of patients in group Dose50 was not exactly clear. SourceBerth-Jones J, Todd G, Hutchinson PE, Thestrup-Pedersen K, Vanhoutte FP: Treatment of psoriasis with oral liarozole: a dose-ranging study. British Journal of Dermatology 2000; 143: 1170-1176. Examples
data(liarozole)
head(liarozole)
# create a contingency table:
table(liarozole)
# the order of the groups is alpha-numeric,
# and "y" for success is of higher order than
# to change the order:
liarozole$Treatment<-factor(liarozole$Treatment,
levels=c("Placebo", "Dose50", "Dose75", "Dose150"))
liarozole$Improved<-factor(liarozole$Improved,
levels=c("y", "n"))
tab<-table(liarozole)
tab
# Approximate simultaneous confidence intervals
# for the differences pDose-pPlacebo:
LCI<-binomRDci(tab, type="Dunnett",
alternative="greater", method="ADD1")
LCI
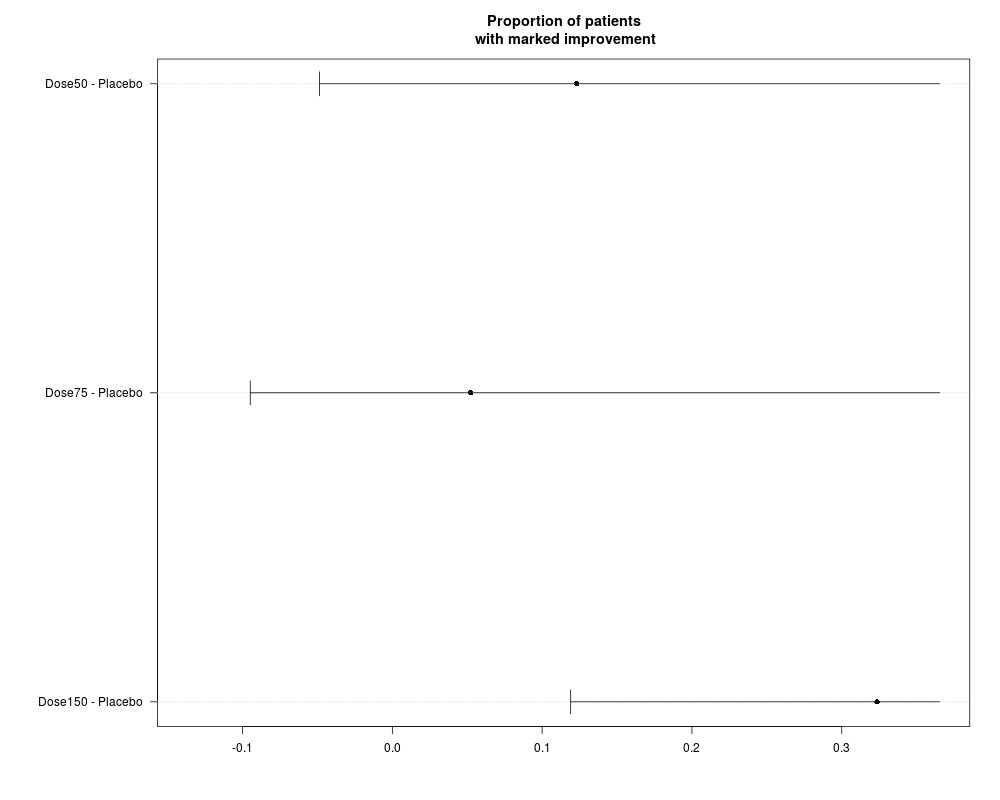
plot(LCI, main="Proportion of patients
with marked improvement")
# Perform a test on increasing trend
# vs. the placebo group:
Ltest<-binomRDtest(tab, type="Williams",
alternative="greater", method="ADD1")
summary(Ltest)
Results
R version 3.3.1 (2016-06-21) -- "Bug in Your Hair"
Copyright (C) 2016 The R Foundation for Statistical Computing
Platform: x86_64-pc-linux-gnu (64-bit)

R is free software and comes with ABSOLUTELY NO WARRANTY.
You are welcome to redistribute it under certain conditions.
Type 'license()' or 'licence()' for distribution details.

R is a collaborative project with many contributors.
Type 'contributors()' for more information and
'citation()' on how to cite R or R packages in publications.

Type 'demo()' for some demos, 'help()' for on-line help, or
'help.start()' for an HTML browser interface to help.
Type 'q()' to quit R.

> library(MCPAN)
> png(filename="/home/ddbj/snapshot/RGM3/R_CC/result/MCPAN/liarozole.Rd_%03d_medium.png", width=480, height=480)
> ### Name: liarozole
> ### Title: Marked improvement of psoriasis after application of liarozole
> ### Aliases: liarozole
> ### Keywords: datasets
>
> ### ** Examples
>
> data(liarozole)
> head(liarozole)
  Improved Treatment
1        y   Placebo
2        y   Placebo
3        n   Placebo
4        n   Placebo
5        n   Placebo
6        n   Placebo
> # create a contingency table:
>
> table(liarozole)
        Treatment
Improved Dose150 Dose50 Dose75 Placebo
       n      21     27     32      32
       y      13      6      4       2
>
>
> # the order of the groups is alpha-numeric,
> # and "y" for success is of higher order than
> # to change the order:
>
> liarozole$Treatment<-factor(liarozole$Treatment,
+  levels=c("Placebo", "Dose50", "Dose75", "Dose150"))
>
> liarozole$Improved<-factor(liarozole$Improved,
+  levels=c("y", "n"))
>
>
> tab<-table(liarozole)
> tab
        Treatment
Improved Placebo Dose50 Dose75 Dose150
       y       2      6      4      13
       n      32     27     32      21
>
> # Approximate simultaneous confidence intervals
> # for the differences  pDose-pPlacebo:
>
> LCI<-binomRDci(tab, type="Dunnett",
+ alternative="greater", method="ADD1")
>
> LCI
Simultaneous 95 percent Add-1 -confidence intervals
 for the difference of proportions (RD)
                  estimate   lower upper
Dose50 - Placebo    0.1230 -0.0486   Inf
Dose75 - Placebo    0.0523 -0.0948   Inf
Dose150 - Placebo   0.3235  0.1191   Inf

where proportions are the probabilities to observe y

>
> plot(LCI, main="Proportion of patients
+  with marked improvement")
>
> # Perform a test on increasing trend
> # vs. the placebo group:
>
> Ltest<-binomRDtest(tab, type="Williams",
+ alternative="greater", method="ADD1")
>
> summary(Ltest)
Summary statistics:
                              Placebo  Dose50  Dose75 Dose150
number of successes            2.0000  6.0000  4.0000 13.0000
number of trials              34.0000 33.0000 36.0000 34.0000
estimated success probability  0.0588  0.1818  0.1111  0.3824

 Contrast matrix:

	 Multiple Comparisons of Means: Williams Contrasts

    Placebo Dose50 Dose75 Dose150
C 1      -1 0.0000 0.0000  1.0000
C 2      -1 0.0000 0.5143  0.4857
C 3      -1 0.3204 0.3495  0.3301

Union intersection test using Add-1  variance estimator:
P-value of the maximum test:
[1] 8e-04

    estimate testat p.val.adj
C 1   0.3235 3.3763    0.0008
C 2   0.1840 2.7357    0.0060
C 3   0.1645 2.7172    0.0065

where proportions are the probability of the event y

>
>
>
>
>
>
> dev.off()
null device
          1
>
|