Supported by Dr. Osamu Ogasawara and  . . |
|
Last data update: 2014.03.03 |
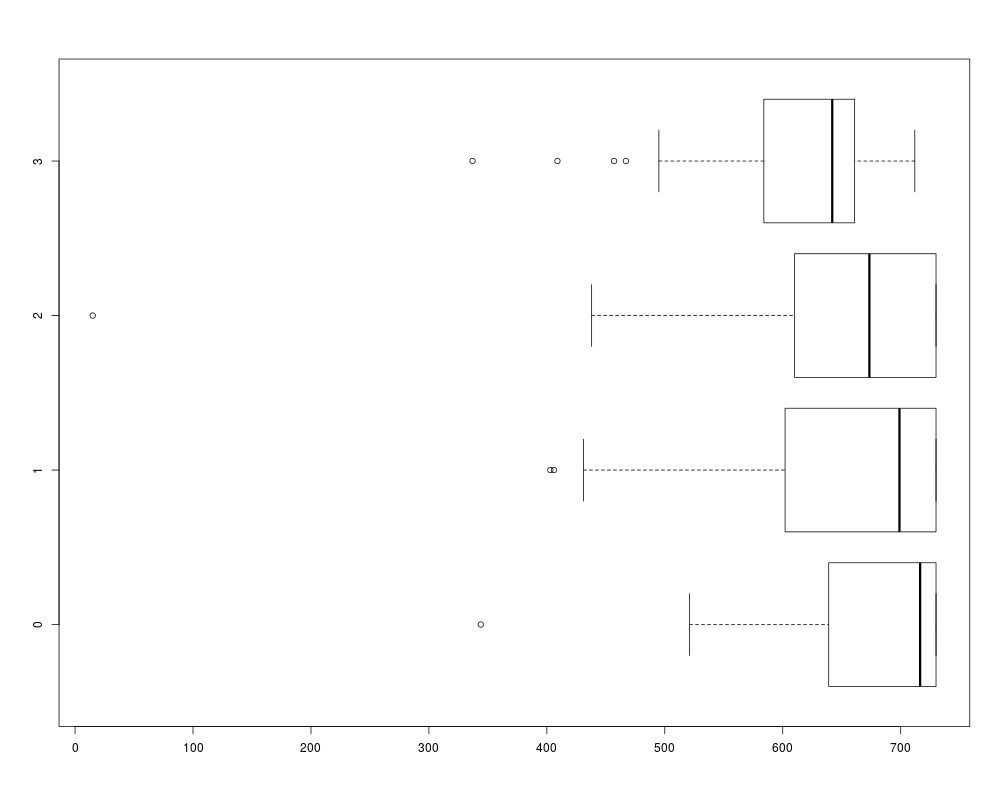
NTP bioassay data: effect of methyleugenol on skin fibromaDescriptionNTP bioassay of methyleugenol: 200 male rats were randomly assigned to 4 treatment groups with balanced sample size 50. Individuals in treatment group 0, 1, 2, and 3 received doses of 0, 37, 75, and 150 mg methyleugenol per kg body weight, respectively. The response variable tumour is the presence of skin fibroma at time of death. The variable death gives individual time of death, with a final sacrifice of surviving animals at 730 days after begin of the assay. Usagedata(methyl) FormatA data frame with 200 observations on the following 3 variables.
SourceNational toxicology program (2000). ReferencesSD Peddada, GE Dinse, JK Haseman (2005): A survival-adjusted quantal response test for comparing tumour incidence rates. Applied Statistics 54, 51-61. Examples
data(methyl)
# raw tumour proportions:
table(methyl[c("group", "tumour")])

# time of death:
boxplot(death~group, data=methyl, horizontal=TRUE)
Results
R version 3.3.1 (2016-06-21) -- "Bug in Your Hair"
Copyright (C) 2016 The R Foundation for Statistical Computing
Platform: x86_64-pc-linux-gnu (64-bit)

R is free software and comes with ABSOLUTELY NO WARRANTY.
You are welcome to redistribute it under certain conditions.
Type 'license()' or 'licence()' for distribution details.

R is a collaborative project with many contributors.
Type 'contributors()' for more information and
'citation()' on how to cite R or R packages in publications.

Type 'demo()' for some demos, 'help()' for on-line help, or
'help.start()' for an HTML browser interface to help.
Type 'q()' to quit R.

> library(MCPAN)
> png(filename="/home/ddbj/snapshot/RGM3/R_CC/result/MCPAN/methyl.Rd_%03d_medium.png", width=480, height=480)
> ### Name: methyl
> ### Title: NTP bioassay data: effect of methyleugenol on skin fibroma
> ### Aliases: methyl
> ### Keywords: datasets
>
> ### ** Examples
>
> data(methyl)
> # raw tumour proportions:
> table(methyl[c("group", "tumour")])
     tumour
group  0  1
    0 49  1
    1 41  9
    2 42  8
    3 45  5
>
> # time of death:
> boxplot(death~group, data=methyl, horizontal=TRUE)
>
>
>
>
>
>
> dev.off()
null device
          1
>
|