Supported by Dr. Osamu Ogasawara and  . . |
|
Last data update: 2014.03.03 |
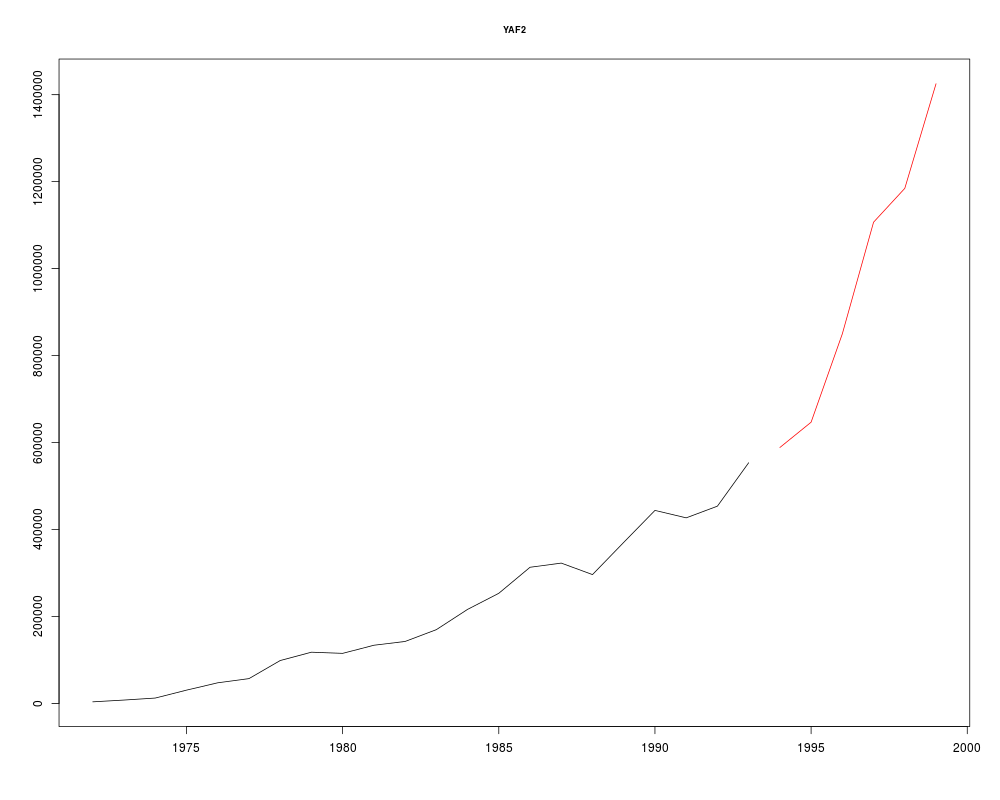
M-Competition dataDescriptionThe time series from the M1 and M3 forecasting competitions. Usagedata(M1) data(M3) FormatM1 is a list of 1001 series and M3 is a list of 3003
series. Each list is of class
Author(s)Muhammad Akram and Rob Hyndman Sourcehttp://forecasters.org/resources/time-series-data/m3-competition/. Detailed results from M3 competition at http://www.insead.edu/facultyresearch/research/doc.cfm?did=1094. ReferencesMakridakis, S., A. Andersen, R. Carbone, R. Fildes, M. Hibon, R. Lewandowski, J. Newton, E. Parzen, and R. Winkler (1982) The accuracy of extrapolation (time series) methods: results of a forecasting competition. Journal of Forecasting, 1, 111–153. Makridakis and Hibon (2000) The M3-competition: results, conclusions and implications. International Journal of Forecasting, 16, 451-476. See Also
ExamplesM1 plot(M1$YAF2) subset(M1,"monthly") Results
R version 3.3.1 (2016-06-21) -- "Bug in Your Hair"
Copyright (C) 2016 The R Foundation for Statistical Computing
Platform: x86_64-pc-linux-gnu (64-bit)

R is free software and comes with ABSOLUTELY NO WARRANTY.
You are welcome to redistribute it under certain conditions.
Type 'license()' or 'licence()' for distribution details.

R is a collaborative project with many contributors.
Type 'contributors()' for more information and
'citation()' on how to cite R or R packages in publications.

Type 'demo()' for some demos, 'help()' for on-line help, or
'help.start()' for an HTML browser interface to help.
Type 'q()' to quit R.

> library(Mcomp)
Loading required package: tseries
Loading required package: forecast
Loading required package: zoo

Attaching package: 'zoo'

The following objects are masked from 'package:base':

    as.Date, as.Date.numeric

Loading required package: timeDate
This is forecast 7.1

> png(filename="/home/ddbj/snapshot/RGM3/R_CC/result/Mcomp/M1.Rd_%03d_medium.png", width=480, height=480)
> ### Name: M1
> ### Title: M-Competition data
> ### Aliases: M1 M3
> ### Keywords: datasets
>
> ### ** Examples
>
> M1
M-Competition data: 1001 time series

           Type of data
Period      DEMOGR INDUST MACRO1 MACRO2 MICRO1 MICRO2 MICRO3 Total
  MONTHLY       75    183     64     92     10     89    104   617
  QUARTERLY     39     18     45     59      5     21     16   203
  YEARLY        30     35     30     29     16     29     12   181
  Total        144    236    139    180     31    139    132  1001
> plot(M1$YAF2)
> subset(M1,"monthly")
M-Competition data: 617 MONTHLY time series

         Type of data
Period    DEMOGR INDUST MACRO1 MACRO2 MICRO1 MICRO2 MICRO3
  MONTHLY     75    183     64     92     10     89    104
>
>
>
>
>
> dev.off()
null device
          1
>
|