Supported by Dr. Osamu Ogasawara and  . . |
|
Last data update: 2014.03.03 |
US Military DemographicsDescriptionThis dataset contains demographic information on every member of the US armed forces including gender, race, and rank. Usagedata(military) FormatA data frame with 1414593 observations on the following 6 variables.
DetailsThe branches covered by this data set include the Army, Navy, Air Force, and Marine Corps. Demographic information on the Coast Guard is contained in the original data set but has not been included here. SourceData provided by the Department of Defense and made available at data.gov. Retrieval date: Feb 20, 2012. ReferencesOpenIntro, openintro.org Examples
data(military)
cond1 <- military$grade == "officer"
cond2 <- military$branch == "army"
cond3 <- military$gender == "female"
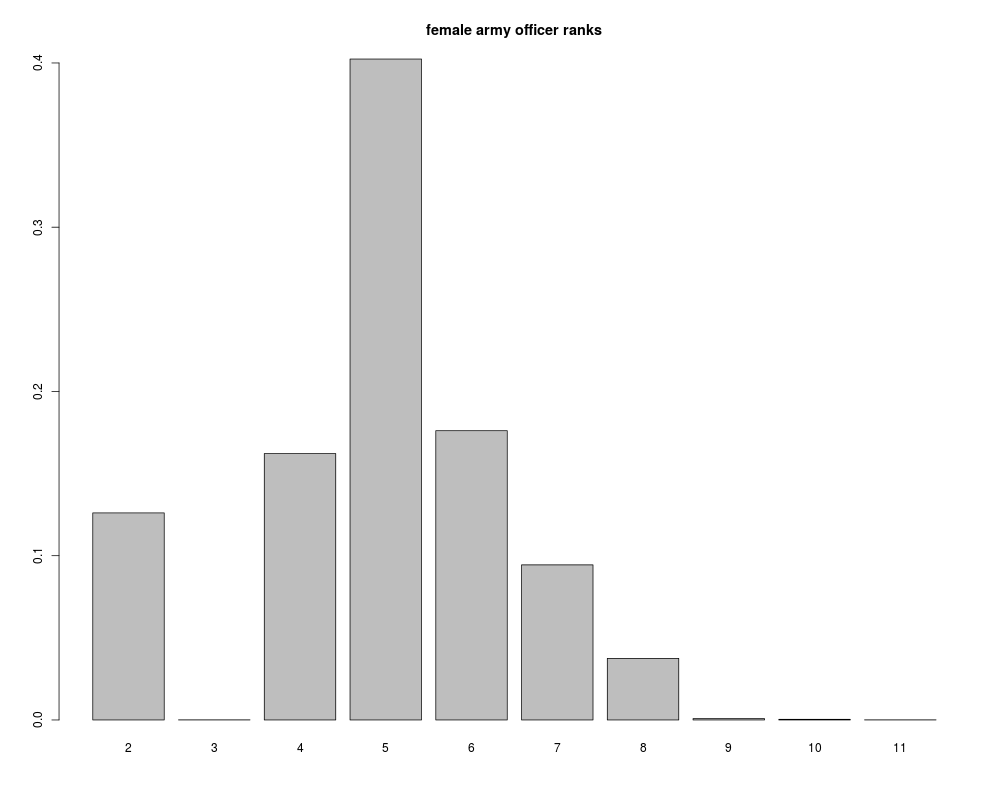
tabF <- table(military$rank[cond1 & cond2 & cond3])
barplot((tabF/sum(tabF)), main = "female army officer ranks")
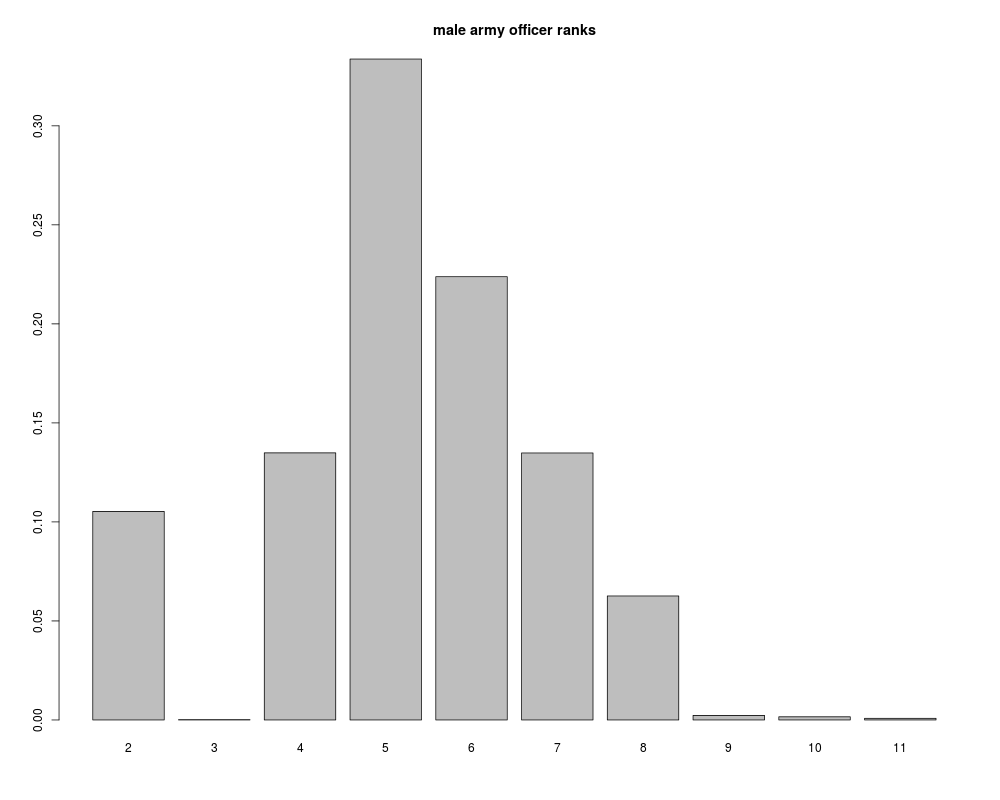
tabM <- table(military$rank[cond1 & cond2 & !cond3])
barplot(tabM/sum(tabM), main = "male army officer ranks")
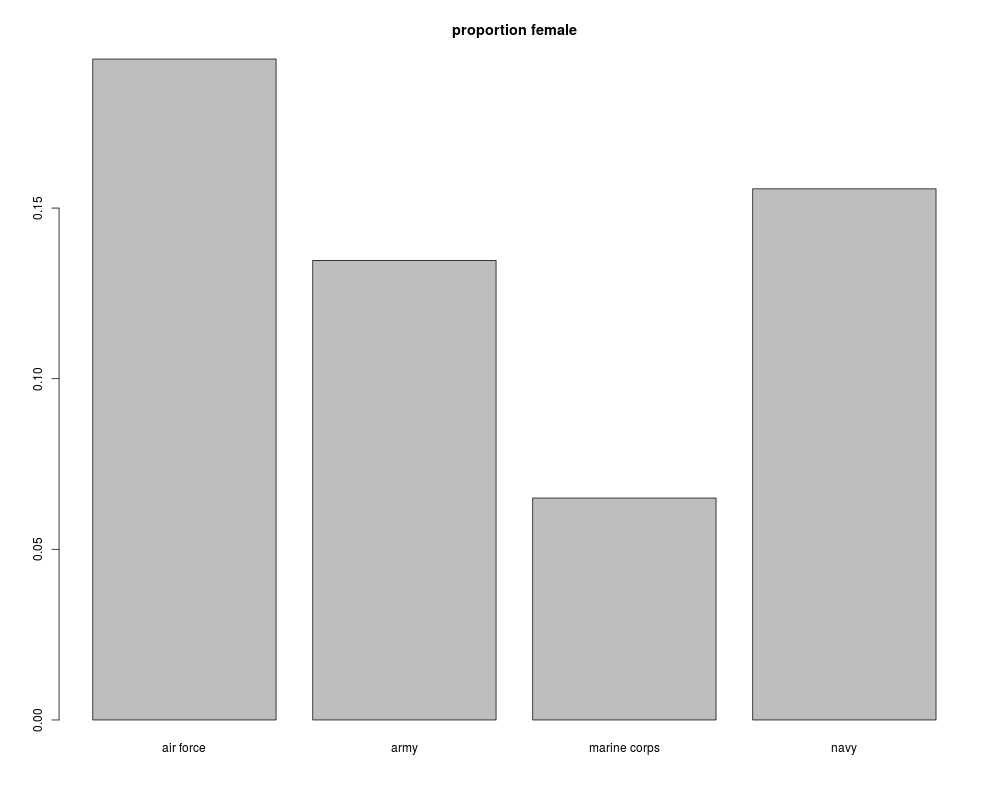
(tabFM <- table(military$branch, military$gender) /
matrix(rep(table(military$branch), 2), ncol = 2))
barplot(tabFM[,1], main = "proportion female")
Results
R version 3.3.1 (2016-06-21) -- "Bug in Your Hair"
Copyright (C) 2016 The R Foundation for Statistical Computing
Platform: x86_64-pc-linux-gnu (64-bit)

R is free software and comes with ABSOLUTELY NO WARRANTY.
You are welcome to redistribute it under certain conditions.
Type 'license()' or 'licence()' for distribution details.

R is a collaborative project with many contributors.
Type 'contributors()' for more information and
'citation()' on how to cite R or R packages in publications.

Type 'demo()' for some demos, 'help()' for on-line help, or
'help.start()' for an HTML browser interface to help.
Type 'q()' to quit R.

> library(OIdata)
Loading required package: RCurl
Loading required package: bitops
Loading required package: maps

 # maps v3.1: updated 'world': all lakes moved to separate new #
 # 'lakes' database. Type '?world' or 'news(package="maps")'.  #


> png(filename="/home/ddbj/snapshot/RGM3/R_CC/result/OIdata/military.Rd_%03d_medium.png", width=480, height=480)
> ### Name: military
> ### Title: US Military Demographics
> ### Aliases: military
> ### Keywords: datasets military demographics
>
> ### ** Examples
>
> data(military)
> cond1 <- military$grade == "officer"
> cond2 <- military$branch == "army"
> cond3 <- military$gender == "female"
> tabF  <- table(military$rank[cond1 & cond2 & cond3])
> barplot((tabF/sum(tabF)), main = "female army officer ranks")
> tabM  <- table(military$rank[cond1 & cond2 & !cond3])
> barplot(tabM/sum(tabM), main = "male army officer ranks")
>
> (tabFM <- table(military$branch, military$gender) /
+           matrix(rep(table(military$branch), 2), ncol = 2))

                   female       male
  air force    0.19367334 0.80632666
  army         0.13464988 0.86535012
  marine corps 0.06503552 0.93496448
  navy         0.15564060 0.84435940
> barplot(tabFM[,1], main = "proportion female")
>
>
>
>
>
> dev.off()
null device
          1
>
|