Supported by Dr. Osamu Ogasawara and  . . |
|
Last data update: 2014.03.03 |
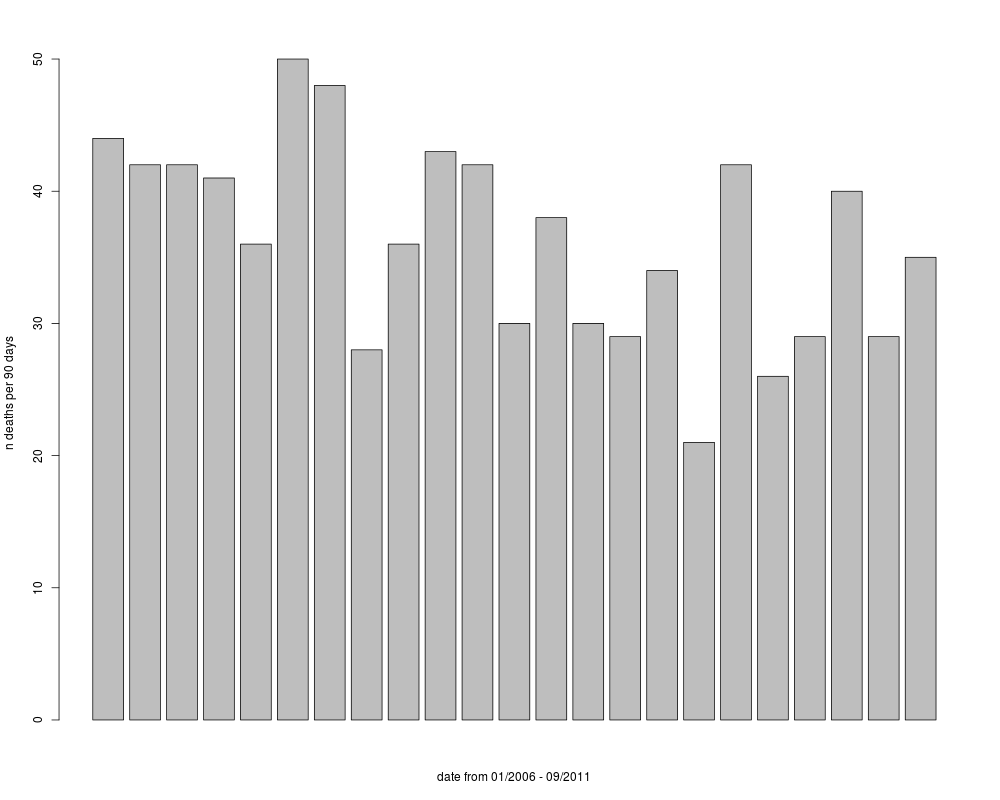
London Murders, 2006-2011DescriptionThis dataset contains the victim name, age, and location of every murder recorded in the Greater London area by the Metropolitan Police from January 1, 2006 to September 7, 2011. Usagedata(murders) FormatA data frame with 838 observations on the following 5 variables.
DetailsTo visualize this data set using a map, see the The Sourcehttp://www.met.police.uk/foi/pdfs/disclosure_2011/september/2011080003610.pdf ReferencesInspired by The Guardian Datablog. Examples
data(murders)
date1    <- as.Date(murders$date,"%m/%d/%y")
date2    <- julian(date1,origin = as.Date("2006-01-02"))
date_cut <- cut(date2, seq(0, 2073, 90))
barplot(table(date_cut), xaxt = "n",
        xlab = "date from 01/2006 - 09/2011",
        ylab = "n deaths per 90 days")

## Not run:
# install.packages("ggplot2")
# install.packages("RColorBrewer")
library(ggplot2)
library(RColorBrewer)
data(london_boroughs)
LB          <- london_boroughs
mtab        <- table(murders$borough)
LB$nmurders <- rep(mtab, rle(as.character(LB$name))$lengths)
p           <- ggplot()
p +
  geom_polygon(data=LB, aes(x=x, y=y, group = name, fill = nmurders),
               colour="white" ) +
  scale_fill_gradientn(colours = brewer.pal(7, "Blues"),
               limits=range(LB$nmurders))

## End(Not run)
Results
R version 3.3.1 (2016-06-21) -- "Bug in Your Hair"
Copyright (C) 2016 The R Foundation for Statistical Computing
Platform: x86_64-pc-linux-gnu (64-bit)

R is free software and comes with ABSOLUTELY NO WARRANTY.
You are welcome to redistribute it under certain conditions.
Type 'license()' or 'licence()' for distribution details.

R is a collaborative project with many contributors.
Type 'contributors()' for more information and
'citation()' on how to cite R or R packages in publications.

Type 'demo()' for some demos, 'help()' for on-line help, or
'help.start()' for an HTML browser interface to help.
Type 'q()' to quit R.

> library(OIdata)
Loading required package: RCurl
Loading required package: bitops
Loading required package: maps

 # maps v3.1: updated 'world': all lakes moved to separate new #
 # 'lakes' database. Type '?world' or 'news(package="maps")'.  #


> png(filename="/home/ddbj/snapshot/RGM3/R_CC/result/OIdata/murders.Rd_%03d_medium.png", width=480, height=480)
> ### Name: murders
> ### Title: London Murders, 2006-2011
> ### Aliases: murders
> ### Keywords: datasets London murder crime map
>
> ### ** Examples
>
> data(murders)
> date1    <- as.Date(murders$date,"%m/%d/%y")
> date2    <- julian(date1,origin = as.Date("2006-01-02"))
> date_cut <- cut(date2, seq(0, 2073, 90))
> barplot(table(date_cut), xaxt = "n",
+         xlab = "date from 01/2006 - 09/2011",
+         ylab = "n deaths per 90 days")
>
> ## Not run:
> ##D # install.packages("ggplot2")
> ##D # install.packages("RColorBrewer")
> ##D library(ggplot2)
> ##D library(RColorBrewer)
> ##D data(london_boroughs)
> ##D LB          <- london_boroughs
> ##D mtab        <- table(murders$borough)
> ##D LB$nmurders <- rep(mtab, rle(as.character(LB$name))$lengths)
> ##D p           <- ggplot()
> ##D p +
> ##D   geom_polygon(data=LB, aes(x=x, y=y, group = name, fill = nmurders),
> ##D                colour="white" ) +
> ##D   scale_fill_gradientn(colours = brewer.pal(7, "Blues"),
> ##D                limits=range(LB$nmurders))
> ## End(Not run)
>
>
>
>
>
> dev.off()
null device
          1
>
|