Supported by Dr. Osamu Ogasawara and  . . |
|
Last data update: 2014.03.03 |
Bollen Data on Industrialization and Political DemocracyDescriptionData set used in some of OpenMx's examples, for instance WLS. The data were reported in Bollen (1989, p. 428, Table 9.4) This set includes data from 75 developing countries each assessed on four measures of democracy measured twice (1960 and 1965), and three measures of industrialization measured once (1960). Usagedata("Bollen")
FormatA data frame with 75 observations on the following 11 numeric variables.
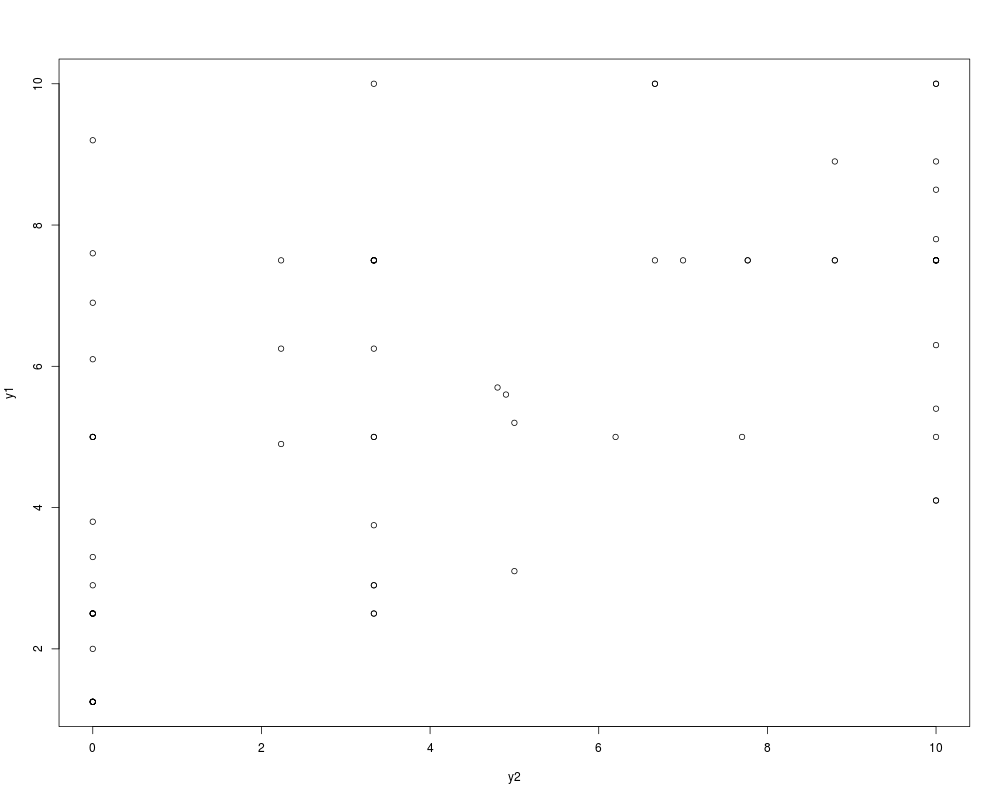
DetailsVariables y1-y4 and y5-y8 are typically used as indicators of the latent trait of “political democracy” in 1960 and 1965 respectively. x1-x3 are used as indicators of industrialization (1960). SourceThe ReferencesBollen, K. A. (1979). Political democracy and the timing of development. American Sociological Review, 44, 572-587. Bollen, K. A. (1980). Issues in the comparative measurement of political democracy. American Sociological Review, 45, 370-390. Bollen, K. A. (1989). Structural equation models. New York: Wiley-Interscience. Examplesdata(Bollen) str(Bollen) plot(y1 ~ y2, data = Bollen) Results
R version 3.3.1 (2016-06-21) -- "Bug in Your Hair"
Copyright (C) 2016 The R Foundation for Statistical Computing
Platform: x86_64-pc-linux-gnu (64-bit)

R is free software and comes with ABSOLUTELY NO WARRANTY.
You are welcome to redistribute it under certain conditions.
Type 'license()' or 'licence()' for distribution details.

R is a collaborative project with many contributors.
Type 'contributors()' for more information and
'citation()' on how to cite R or R packages in publications.

Type 'demo()' for some demos, 'help()' for on-line help, or
'help.start()' for an HTML browser interface to help.
Type 'q()' to quit R.

> library(OpenMx)
Loading required package: digest
Loading required package: MASS
Loading required package: Matrix
Loading required package: Rcpp
Loading required package: parallel

Attaching package: 'OpenMx'

The following objects are masked from 'package:Matrix':

    %&%, expm

> png(filename="/home/ddbj/snapshot/RGM3/R_CC/result/OpenMx/Bollen_data.Rd_%03d_medium.png", width=480, height=480)
> ### Name: Bollen
> ### Title: Bollen Data on Industrialization and Political Democracy
> ### Aliases: Bollen
> ### Keywords: datasets
>
> ### ** Examples
>
> data(Bollen)
> str(Bollen)
'data.frame':	75 obs. of  11 variables:
 $ y1: num  2.5 1.25 7.5 8.9 10 7.5 7.5 7.5 2.5 10 ...
 $ y2: num  0 0 8.8 8.8 3.33 ...
 $ y3: num  3.33 3.33 10 10 10 ...
 $ y4: num  0 0 9.2 9.2 6.67 ...
 $ y5: num  1.25 6.25 8.75 8.91 7.5 ...
 $ y6: num  0 1.1 8.09 8.13 3.33 ...
 $ y7: num  3.73 6.67 10 10 10 ...
 $ y8: num  3.333 0.737 8.212 4.615 6.667 ...
 $ x1: num  4.44 5.38 5.96 6.29 5.86 ...
 $ x2: num  3.64 5.06 6.26 7.57 6.82 ...
 $ x3: num  2.56 3.57 5.22 6.27 4.57 ...
> plot(y1 ~ y2, data = Bollen)
>
>
>
>
>
> dev.off()
null device
          1
>
|