Supported by Dr. Osamu Ogasawara and  . . |
|
Last data update: 2014.03.03 |
Rat growth dataDescriptionEach rat in the data set was measured on 11 dates expressed as days from start of the experiment. The purpose was to see if the growth rate was the same for each group. Usagedata(rats.df) FormatA data frame with 176 observations on the following 5 variables:
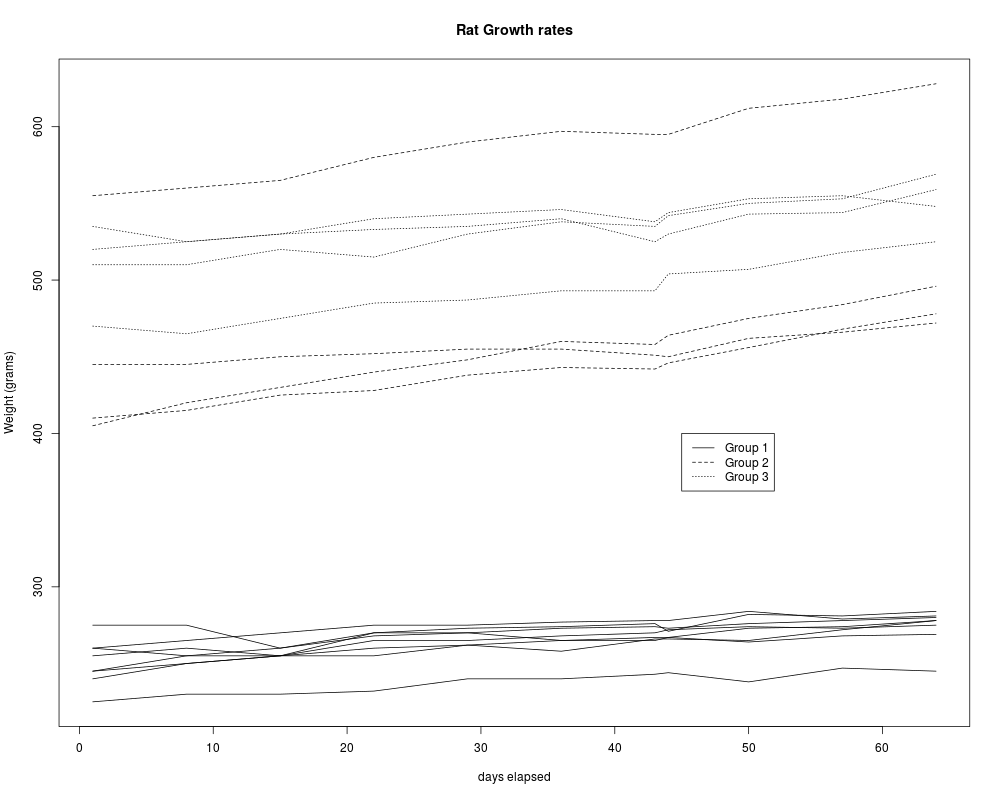
DetailsHand and Crowder (1996) describe data on the body weights of rats measured over 64 days. These data also appear in Table 2.4 of Crowder and Hand (1990). The body weights of the rats (in grams) are measured on day 1 and every seven days thereafter until day 64, with an extra measurement on day 44. The experiment started several weeks before “day 1.” There are three groups of rats, each on a different diet. SourcePinheiro, J. C. and Bates, D. M. (2000), Mixed-Effects Models in S and S-PLUS, Springer, New York. (Appendix A.3) Crowder, M. and Hand, D. (1990), Analysis of Repeated Measures, Chapman and Hall, London. Hand, D. and Crowder, M. (1996), Practical Longitudinal Data Analysis, Chapman and Hall, London. Examples
data(rats.df)
group.vec<-as.numeric(rats.df$group)
# convert group from factor to vector
plot(growth~day,type="n",
data=rats.df,
xlab="days elapsed",
ylab="Weight (grams)",
main="Rat Growth rates")
for(i in (0:15)){
index<-(1:11) + i*11
lines(rats.df$day[index],rats.df$growth[index],
lty=group.vec[index[1]])
}
legend(45,400,paste("Group",1:3),lty=c(1,2,3))
Results
R version 3.3.1 (2016-06-21) -- "Bug in Your Hair"
Copyright (C) 2016 The R Foundation for Statistical Computing
Platform: x86_64-pc-linux-gnu (64-bit)

R is free software and comes with ABSOLUTELY NO WARRANTY.
You are welcome to redistribute it under certain conditions.
Type 'license()' or 'licence()' for distribution details.

R is a collaborative project with many contributors.
Type 'contributors()' for more information and
'citation()' on how to cite R or R packages in publications.

Type 'demo()' for some demos, 'help()' for on-line help, or
'help.start()' for an HTML browser interface to help.
Type 'q()' to quit R.

> library(R330)
Loading required package: s20x
Loading required package: leaps
Loading required package: rgl
Loading required package: lattice
> png(filename="/home/ddbj/snapshot/RGM3/R_CC/result/R330/rats.df.Rd_%03d_medium.png", width=480, height=480)
> ### Name: rats.df
> ### Title: Rat growth data
> ### Aliases: rats.df
> ### Keywords: datasets
>
> ### ** Examples
>
> data(rats.df)
> group.vec<-as.numeric(rats.df$group)
> # convert group from factor to vector
> plot(growth~day,type="n",
+ data=rats.df,
+ xlab="days elapsed",
+ ylab="Weight (grams)",
+ main="Rat Growth rates")
> for(i in (0:15)){
+ index<-(1:11) + i*11
+ lines(rats.df$day[index],rats.df$growth[index],
+ lty=group.vec[index[1]])
+ }
> legend(45,400,paste("Group",1:3),lty=c(1,2,3))
>
>
>
>
>
> dev.off()
null device
          1
>
|