Supported by Dr. Osamu Ogasawara and  . . |
|
Last data update: 2014.03.03 |
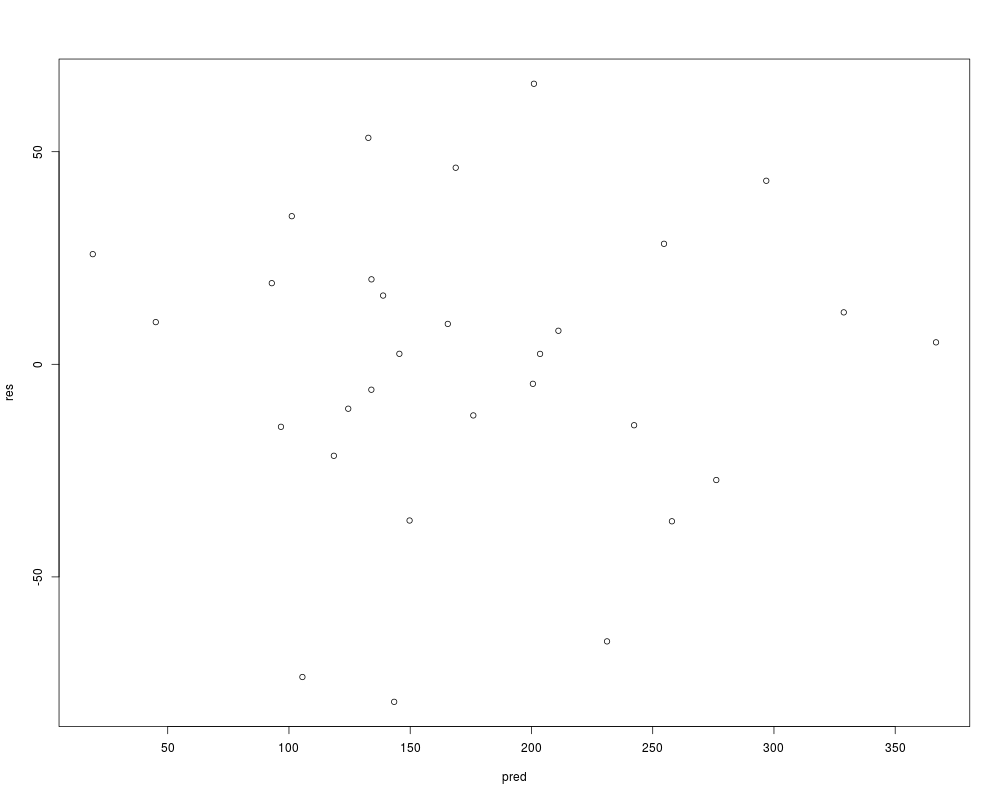
Rubber Specimen DataDescriptionThirty rubber specimens were rubbed with an abrasive metal. Usagedata(rubber.df) FormatA data frame with 30 observations on the following 3 variables:
SourceGEP Box, WR Cousins, FR Hindsworth, H Heeny, M Milbourne, W Spendley and WL Stevens (1957). In OL Davies (Ed.) Statistical Methods in Research and Production, 3rd Ed. Oliver and Boyd, London. ReferencesChambers, J. M. et al. (1983). Graphical Methods for Data Analysis. Duxbury Press: Boston. Examplesdata(rubber.df) rubber.lm<-lm(abloss~hardness+tensile,data=rubber.df) pred<-fitted.values(rubber.lm) res<-residuals(rubber.lm) plot(pred,res) Results
R version 3.3.1 (2016-06-21) -- "Bug in Your Hair"
Copyright (C) 2016 The R Foundation for Statistical Computing
Platform: x86_64-pc-linux-gnu (64-bit)

R is free software and comes with ABSOLUTELY NO WARRANTY.
You are welcome to redistribute it under certain conditions.
Type 'license()' or 'licence()' for distribution details.

R is a collaborative project with many contributors.
Type 'contributors()' for more information and
'citation()' on how to cite R or R packages in publications.

Type 'demo()' for some demos, 'help()' for on-line help, or
'help.start()' for an HTML browser interface to help.
Type 'q()' to quit R.

> library(R330)
Loading required package: s20x
Loading required package: leaps
Loading required package: rgl
Loading required package: lattice
> png(filename="/home/ddbj/snapshot/RGM3/R_CC/result/R330/rubber.df.Rd_%03d_medium.png", width=480, height=480)
> ### Name: rubber.df
> ### Title: Rubber Specimen Data
> ### Aliases: rubber.df
> ### Keywords: datasets
>
> ### ** Examples
>
> data(rubber.df)
> rubber.lm<-lm(abloss~hardness+tensile,data=rubber.df)
> pred<-fitted.values(rubber.lm)
> res<-residuals(rubber.lm)
> plot(pred,res)
>
>
>
>
>
> dev.off()
null device
          1
>
|
Created & Maintained by Osamu Ogasawara (osamu.ogasawara@gmail.com) and 