Supported by Dr. Osamu Ogasawara and  . . |
|
Last data update: 2014.03.03 |
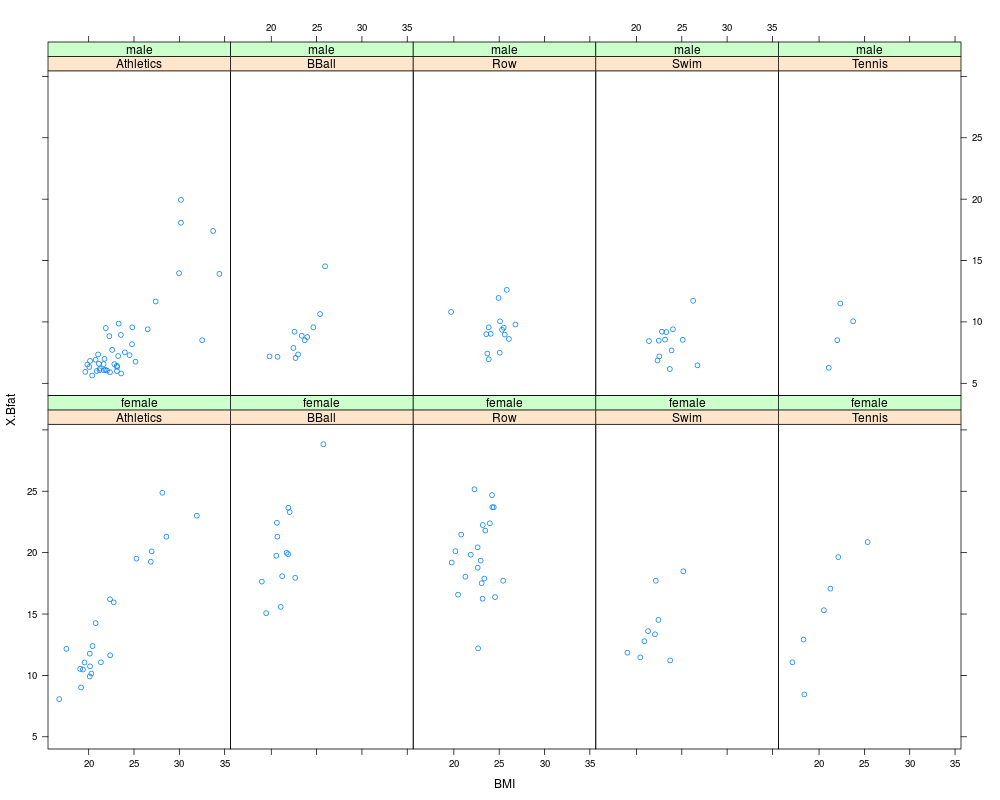
Australian Institute of SportDescriptionData on 102 male and 100 female athletes collected at the Australian Institute of Sport, courtesy of Richard Telford and Ross Cunningham. Usagedata(sport.df) FormatA data frame with 158 observations on the following 5 variables:
SourceRichard Telford and Ross Cunningham, Australian National University. ReferencesCook, R. D., and Weisberg, S. (1994). An Introduction to Regression Graphics. Wiley, New York. Examplesdata(sport.df) library(lattice) xyplot(X.Bfat~BMI|sport*sex,xlab="BMI",ylab="X.Bfat",data=sport.df) Results
R version 3.3.1 (2016-06-21) -- "Bug in Your Hair"
Copyright (C) 2016 The R Foundation for Statistical Computing
Platform: x86_64-pc-linux-gnu (64-bit)

R is free software and comes with ABSOLUTELY NO WARRANTY.
You are welcome to redistribute it under certain conditions.
Type 'license()' or 'licence()' for distribution details.

R is a collaborative project with many contributors.
Type 'contributors()' for more information and
'citation()' on how to cite R or R packages in publications.

Type 'demo()' for some demos, 'help()' for on-line help, or
'help.start()' for an HTML browser interface to help.
Type 'q()' to quit R.

> library(R330)
Loading required package: s20x
Loading required package: leaps
Loading required package: rgl
Loading required package: lattice
> png(filename="/home/ddbj/snapshot/RGM3/R_CC/result/R330/sport.df.Rd_%03d_medium.png", width=480, height=480)
> ### Name: sport.df
> ### Title: Australian Institute of Sport
> ### Aliases: sport.df
> ### Keywords: datasets
>
> ### ** Examples
>
> data(sport.df)
> library(lattice)
> xyplot(X.Bfat~BMI|sport*sex,xlab="BMI",ylab="X.Bfat",data=sport.df)
>
>
>
>
>
> dev.off()
null device
          1
>
|
Created & Maintained by Osamu Ogasawara (osamu.ogasawara@gmail.com) and 