Supported by Dr. Osamu Ogasawara and  . . |
|
Last data update: 2014.03.03 |
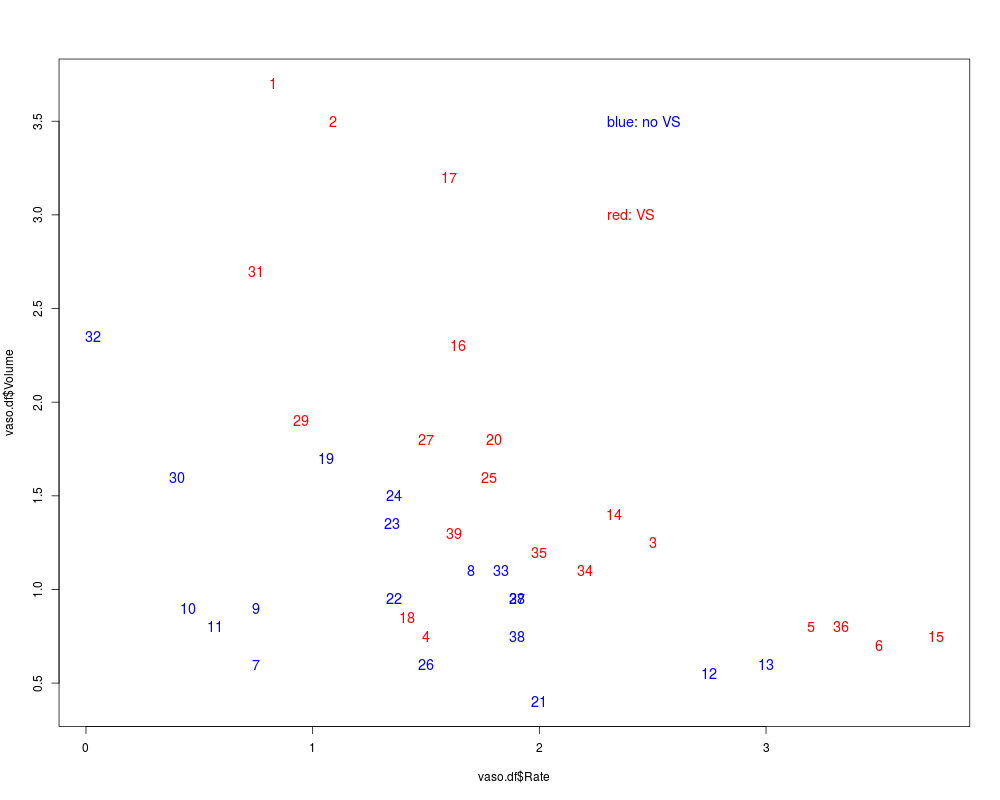
vaso-constriction dataDescriptionData from a study of reflex vaso-constriction (narrowing of the blood vessels) of the skin of the fingers Usagedata(vaso.df) FormatA data frame with 39 observations on the following 3 variables.
SourceFinney, D. J. (1947). The estimation from individual records of the relationship between dose and quantal response. Biometrika, 34, 320-334. ReferencesPregibon, D. (1981) Logistic regression diagnostics. Annals of Statistics, 9,705-724. Examplesdata(vaso.df) plot(vaso.df$Rate,vaso.df$Volume,type="n", cex=1.2) text(vaso.df$Rate,vaso.df$Volume,1:39, col=ifelse(vaso.df$Response==1, "red","blue"),cex=1.2) text(2.3,3.5,"blue: no VS", col="blue",adj=0, cex=1.2) text(2.3,3.0,"red: VS", col="red", adj=0, cex=1.2) Results
R version 3.3.1 (2016-06-21) -- "Bug in Your Hair"
Copyright (C) 2016 The R Foundation for Statistical Computing
Platform: x86_64-pc-linux-gnu (64-bit)

R is free software and comes with ABSOLUTELY NO WARRANTY.
You are welcome to redistribute it under certain conditions.
Type 'license()' or 'licence()' for distribution details.

R is a collaborative project with many contributors.
Type 'contributors()' for more information and
'citation()' on how to cite R or R packages in publications.

Type 'demo()' for some demos, 'help()' for on-line help, or
'help.start()' for an HTML browser interface to help.
Type 'q()' to quit R.

> library(R330)
Loading required package: s20x
Loading required package: leaps
Loading required package: rgl
Loading required package: lattice
> png(filename="/home/ddbj/snapshot/RGM3/R_CC/result/R330/vaso.df.Rd_%03d_medium.png", width=480, height=480)
> ### Name: vaso.df
> ### Title: vaso-constriction data
> ### Aliases: vaso.df
> ### Keywords: datasets
>
> ### ** Examples
>
> data(vaso.df)
> plot(vaso.df$Rate,vaso.df$Volume,type="n", cex=1.2)
> text(vaso.df$Rate,vaso.df$Volume,1:39,
+ col=ifelse(vaso.df$Response==1, "red","blue"),cex=1.2)
> text(2.3,3.5,"blue: no VS", col="blue",adj=0, cex=1.2)
> text(2.3,3.0,"red: VS", col="red", adj=0, cex=1.2)
>
>
>
>
>
> dev.off()
null device
          1
>
|
Created & Maintained by Osamu Ogasawara (osamu.ogasawara@gmail.com) and 