The lollipop geom is used to create lollipop charts.
Lollipop charts are the creation of Andy Cotgreave going back to 2011. They
are a combination of a thin segment, starting at with a dot at the top and are a
suitable alternative to or replacement for bar charts.
Set of aesthetic mappings created by aes or
aes_. If specified and inherit.aes = TRUE (the
default), it is combined with the default mapping at the top level of the
plot. You must supply mapping if there is no plot mapping.
data
The data to be displayed in this layer. There are three
options:
If NULL, the default, the data is inherited from the plot
data as specified in the call to ggplot.
A data.frame, or other object, will override the plot
data. All objects will be fortified to produce a data frame. See
fortify for which variables will be created.
A function will be called with a single argument,
the plot data. The return value must be a data.frame., and
will be used as the layer data.
...
other arguments passed on to layer. These are
often aesthetics, used to set an aesthetic to a fixed value, like
color = "red" or size = 3. They may also be parameters
to the paired geom/stat.
horizontal
If is FALSE (the default), the function
will draw the lollipops up from the X axis (i.e. it will set xend
to x & yend to 0). If TRUE, it wiill set
yend to y & xend to 0). Make sure you map the
x & y aesthetics accordingly. This parameter helps avoid
the need for coord_flip().
point.colour
the colour of the point
point.size
the size of the point
stem.colour
the colour of the stem
stem.size
the size of the stem
na.rm
If FALSE (the default), removes missing values with
a warning. If TRUE silently removes missing values.
show.legend
logical. Should this layer be included in the legends?
NA, the default, includes if any aesthetics are mapped.
FALSE never includes, and TRUE always includes.
inherit.aes
If FALSE, overrides the default aesthetics,
rather than combining with them. This is most useful for helper functions
that define both data and aesthetics and shouldn't inherit behaviour from
the default plot specification, e.g. borders.
Details
Use the horizontal parameter to abate the need for coord_flip()
(see the Arguments section for details).
R version 3.3.1 (2016-06-21) -- "Bug in Your Hair"
Copyright (C) 2016 The R Foundation for Statistical Computing
Platform: x86_64-pc-linux-gnu (64-bit)
R is free software and comes with ABSOLUTELY NO WARRANTY.
You are welcome to redistribute it under certain conditions.
Type 'license()' or 'licence()' for distribution details.
R is a collaborative project with many contributors.
Type 'contributors()' for more information and
'citation()' on how to cite R or R packages in publications.
Type 'demo()' for some demos, 'help()' for on-line help, or
'help.start()' for an HTML browser interface to help.
Type 'q()' to quit R.
> library(SciencesPo)
Loading required package: ggplot2
initializing ... done
> png(filename="/home/ddbj/snapshot/RGM3/R_CC/result/SciencesPo/geom_lollipop.Rd_%03d_medium.png", width=480, height=480)
> ### Name: geom_lollipop
> ### Title: Lollipop charts
> ### Aliases: GeomLollipop geom_lollipop
> ### Keywords: datasets
>
> ### ** Examples
>
>
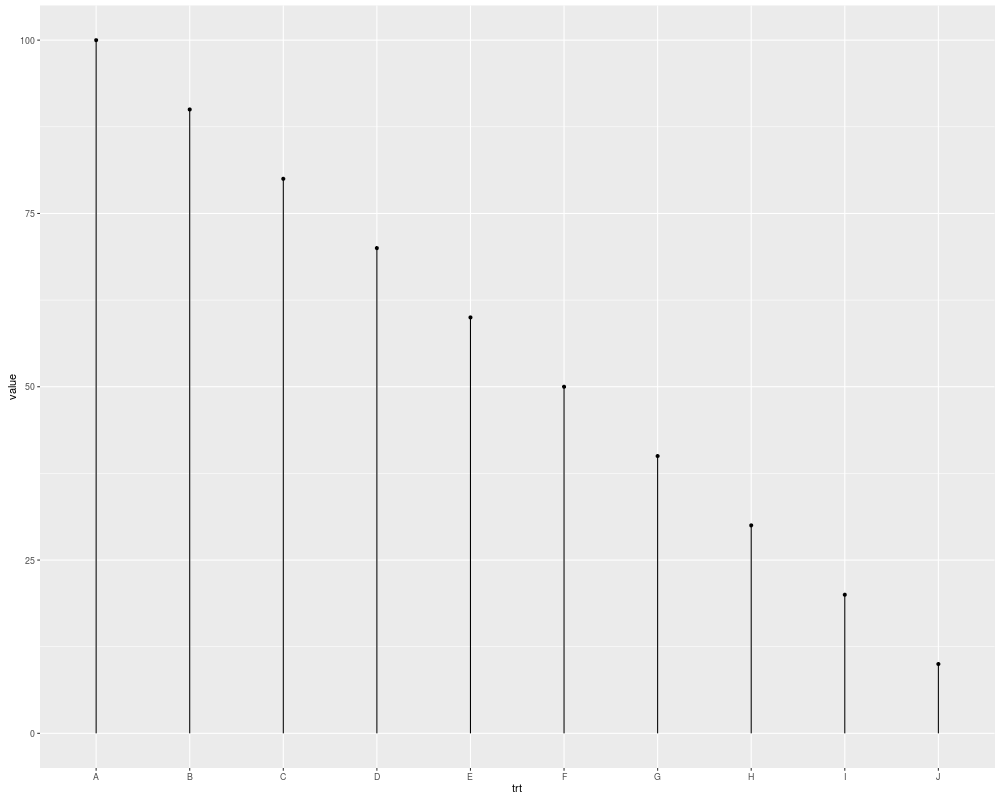
> df <- data.frame(trt=LETTERS[1:10],
+ value=seq(100, 10, by=-10))
>
> ggplot(df, aes(trt, value)) + geom_lollipop()
>
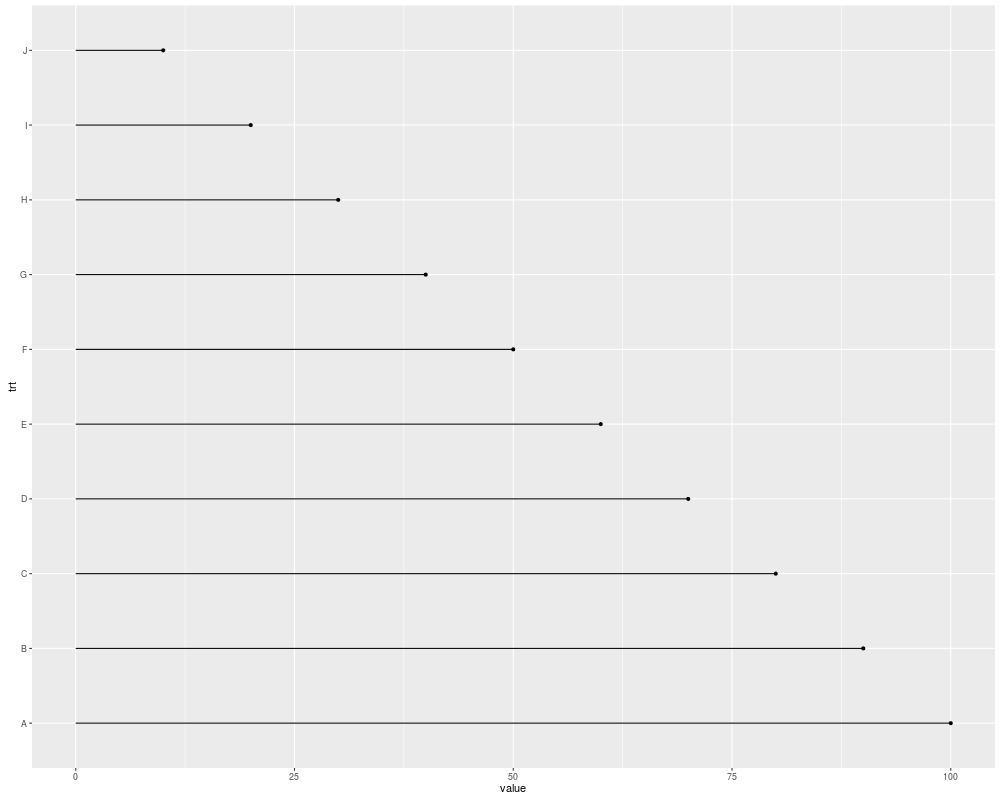
> ggplot(df, aes(value, trt)) + geom_lollipop(horizontal=TRUE)
>
>
>
>
>
> dev.off()
null device
1
>
 .
.