R version 3.3.1 (2016-06-21) -- "Bug in Your Hair"
Copyright (C) 2016 The R Foundation for Statistical Computing
Platform: x86_64-pc-linux-gnu (64-bit)
R is free software and comes with ABSOLUTELY NO WARRANTY.
You are welcome to redistribute it under certain conditions.
Type 'license()' or 'licence()' for distribution details.
R is a collaborative project with many contributors.
Type 'contributors()' for more information and
'citation()' on how to cite R or R packages in publications.
Type 'demo()' for some demos, 'help()' for on-line help, or
'help.start()' for an HTML browser interface to help.
Type 'q()' to quit R.
> library(SciencesPo)
Loading required package: ggplot2
initializing ... done
> png(filename="/home/ddbj/snapshot/RGM3/R_CC/result/SciencesPo/geom_spotlight.Rd_%03d_medium.png", width=480, height=480)
> ### Name: GeomSpotlight
> ### Title: Automatically enclose points in a polygon
> ### Aliases: GeomSpotlight geom_spotlight
> ### Keywords: datasets
>
> ### ** Examples
>
> d <- data.frame(x=c(1,1,2),y=c(1,2,2)*100)
>
> gg <- ggplot(d,aes(x,y))
> gg <- gg + scale_x_continuous(expand=c(0.5,1))
> gg <- gg + scale_y_continuous(expand=c(0.5,1))
>
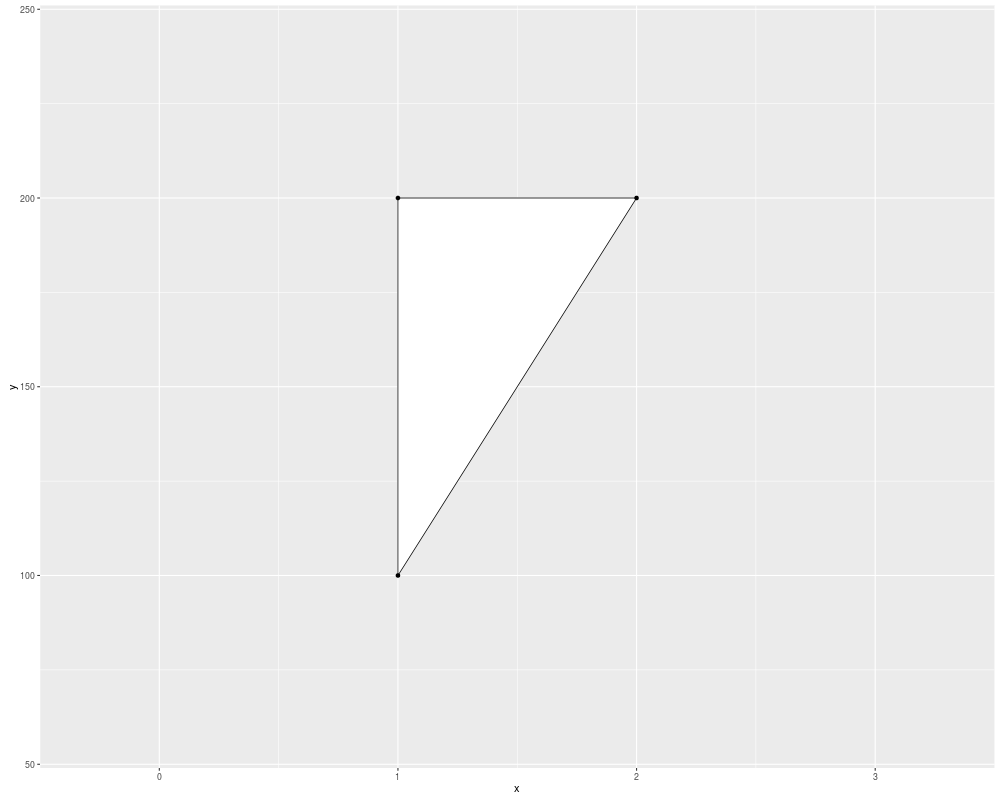
> gg + geom_spotlight(s_shape=1, expand=0) + geom_point()
>
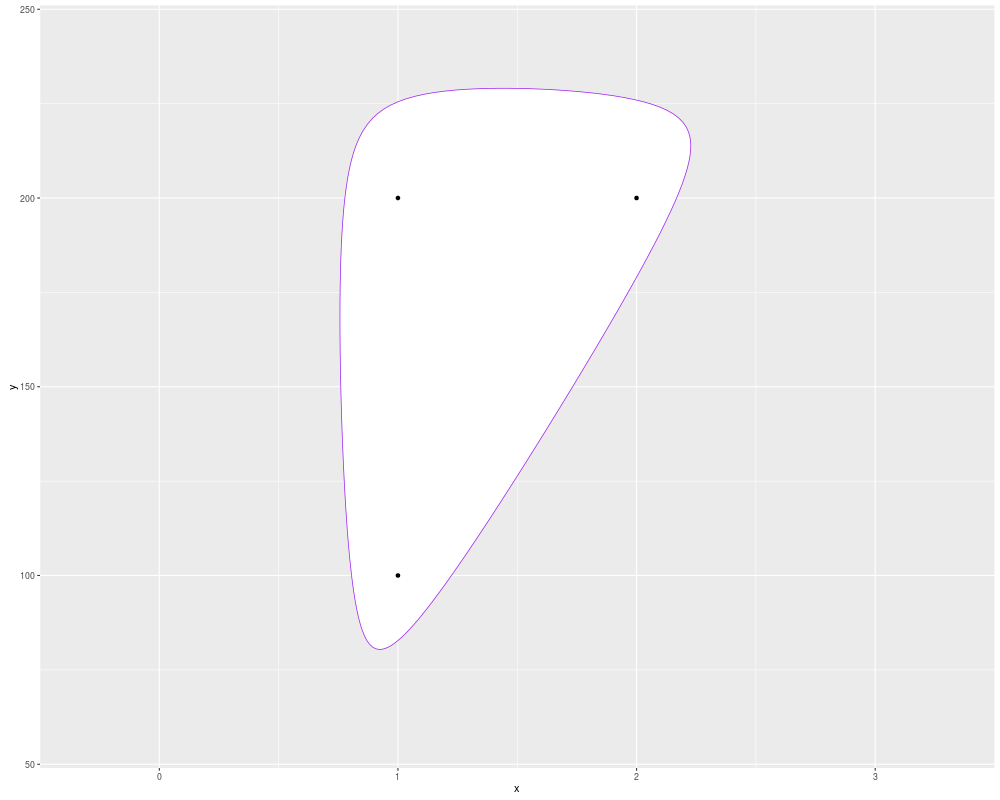
> gg + geom_spotlight(s_shape=0.5, expand=0.1, colour="purple") + geom_point()
>
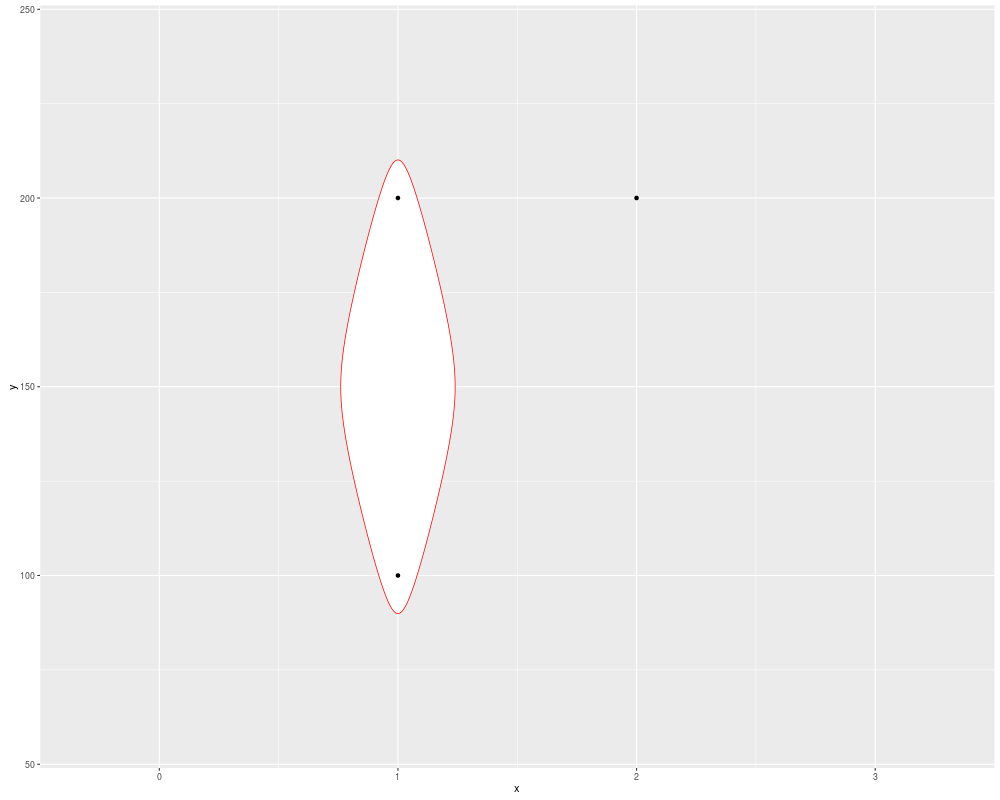
> gg + geom_spotlight(data=subset(d, x==1), colour="red", spread=0.02) +
+ geom_point()
>
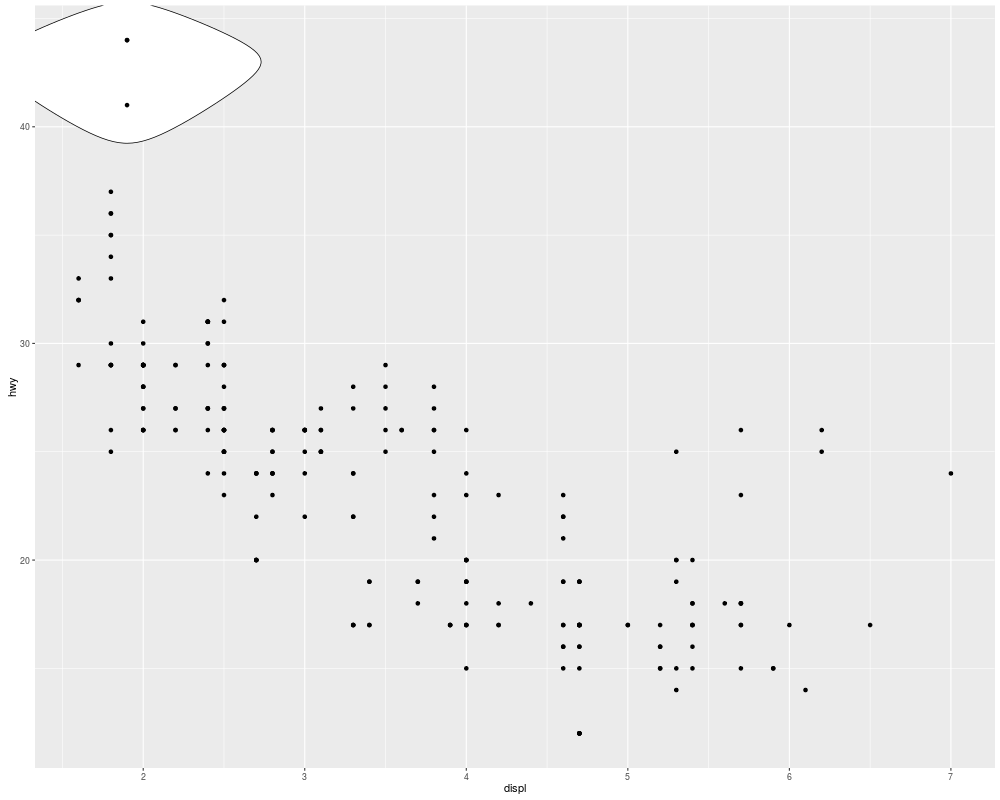
> gg <- ggplot(mpg, aes(displ, hwy))
> gg + geom_spotlight(data=subset(mpg, hwy>40)) + geom_point()
>
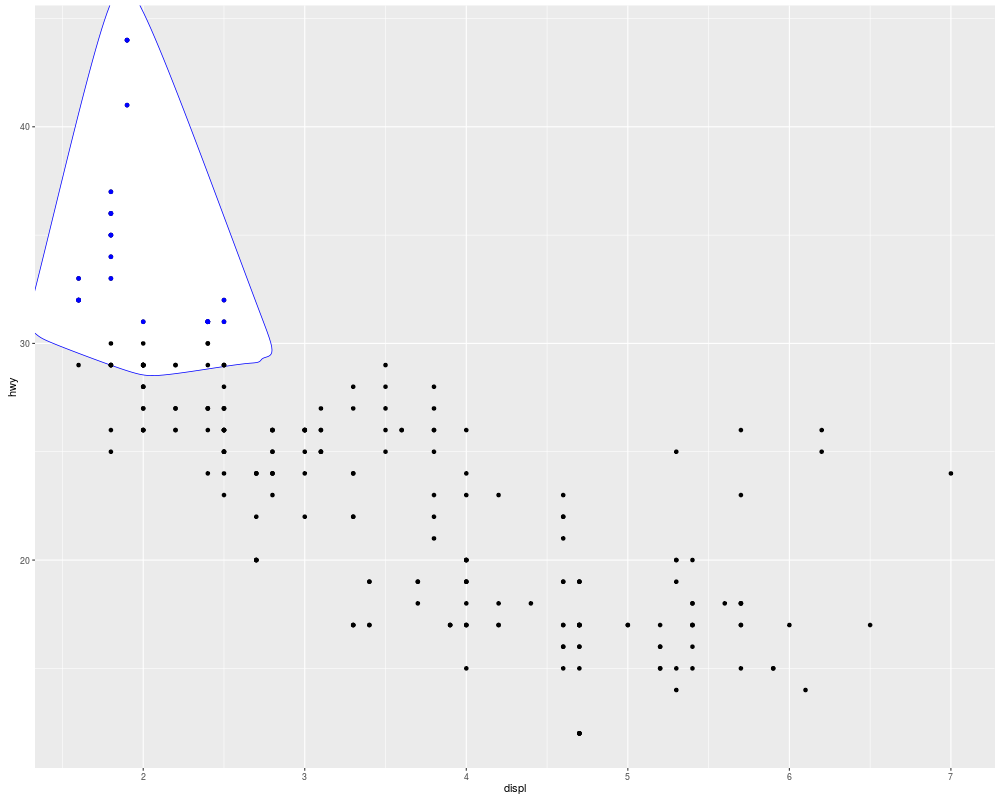
> ss <- subset(mpg,hwy>30 & displ<3)
>
> gg + geom_spotlight(data=ss, colour="blue", s_shape=.7, expand=0.07) +
+ geom_point() + geom_point(data=ss, colour="blue")
>
>
>
>
>
>
> dev.off()
null device
1
>
 .
.