Supported by Dr. Osamu Ogasawara and  . . |
|
Last data update: 2014.03.03 |
Completely Randomized Design (CRD)DescriptionThe experiment consists of 16 treatments (cultivars) of sorghum conducted in a balanced squared lattice design and the yield by plot (kg/plot). Usagedata(sorghum) sorghum FormatAn incomplete balanced block design with 4 blocks, 16 treatments,
and 5 repetitions, that is, the yield of each treatment is measured 5 times.
DetailsThe experiment was conducted at EMBRAPA Milho e Sorgo (The Brazilian Agricultural Research Corporation, Corn and Sorghum section). SourceRamalho, M.A.P. and Ferreira, D.F. and Oliveira, A.C. (2000). Experimenta<c3><a7><c3><a3>o em Gen<c3><a9>tica e Melhoramento de Plantas. Editora UFLA, Lavras, Brazil, page 167. Examples
library(ScottKnott)

data(sorghum)

av <- aov(y ~ r/bl + x,
          data=sorghum$dfm)

sk <- SK(av,
         which='x',
         sig.level=0.05)

summary(sk)

plot(sk)
Results
R version 3.3.1 (2016-06-21) -- "Bug in Your Hair"
Copyright (C) 2016 The R Foundation for Statistical Computing
Platform: x86_64-pc-linux-gnu (64-bit)
R is free software and comes with ABSOLUTELY NO WARRANTY.
You are welcome to redistribute it under certain conditions.
Type 'license()' or 'licence()' for distribution details.
R is a collaborative project with many contributors.
Type 'contributors()' for more information and
'citation()' on how to cite R or R packages in publications.
Type 'demo()' for some demos, 'help()' for on-line help, or
'help.start()' for an HTML browser interface to help.
Type 'q()' to quit R.
> library(ScottKnott)
> png(filename="/home/ddbj/snapshot/RGM3/R_CC/result/ScottKnott/sorghum.Rd_%03d_medium.png", width=480, height=480)
> ### Name: sorghum
> ### Title: Completely Randomized Design (CRD)
> ### Aliases: sorghum
> ### Keywords: datasets
>
> ### ** Examples
>
> library(ScottKnott)
>
> data(sorghum)
>
> av <- aov(y ~ r/bl + x,
+ data=sorghum$dfm)
>
> sk <- SK(av,
+ which='x',
+ sig.level=0.05)
>
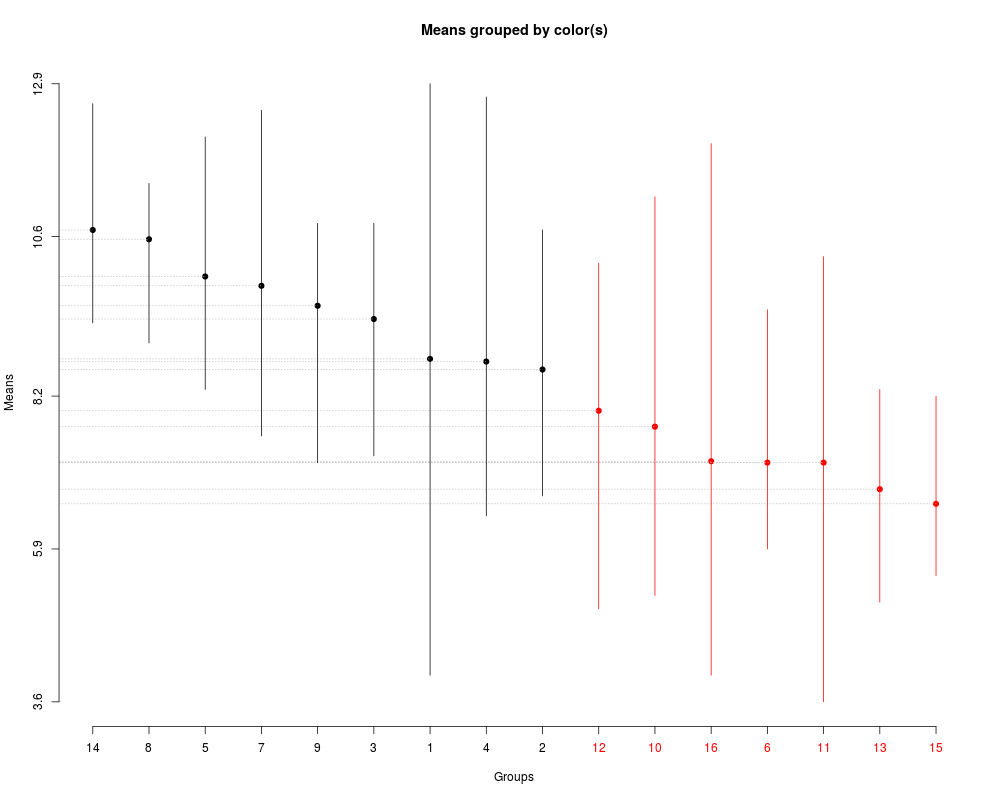
> summary(sk)
Levels Means SK(5%)
14 10.70 a
8 10.56 a
5 10.00 a
7 9.86 a
9 9.56 a
3 9.36 a
1 8.76 a
4 8.72 a
2 8.60 a
12 7.98 b
10 7.74 b
16 7.22 b
6 7.20 b
11 7.20 b
13 6.80 b
15 6.58 b
>
> plot(sk)
>
>
>
>
>
> dev.off()
null device
1
>
|