Supported by Dr. Osamu Ogasawara and  . . |
|
Last data update: 2014.03.03 |
Onions dataDescriptionThe Usagedata(onions) FormatThis data frame contains the following columns:
SourceRatkowsky, D. A. (1983). Nonlinear Regression Modeling: A Unified Practical Approach. New York: Marcel Dekker. ReferencesRuppert, D., Wand, M.P. and Carroll, R.J. (2003) Examples
library(SemiPar)
data(onions)
attach(onions)
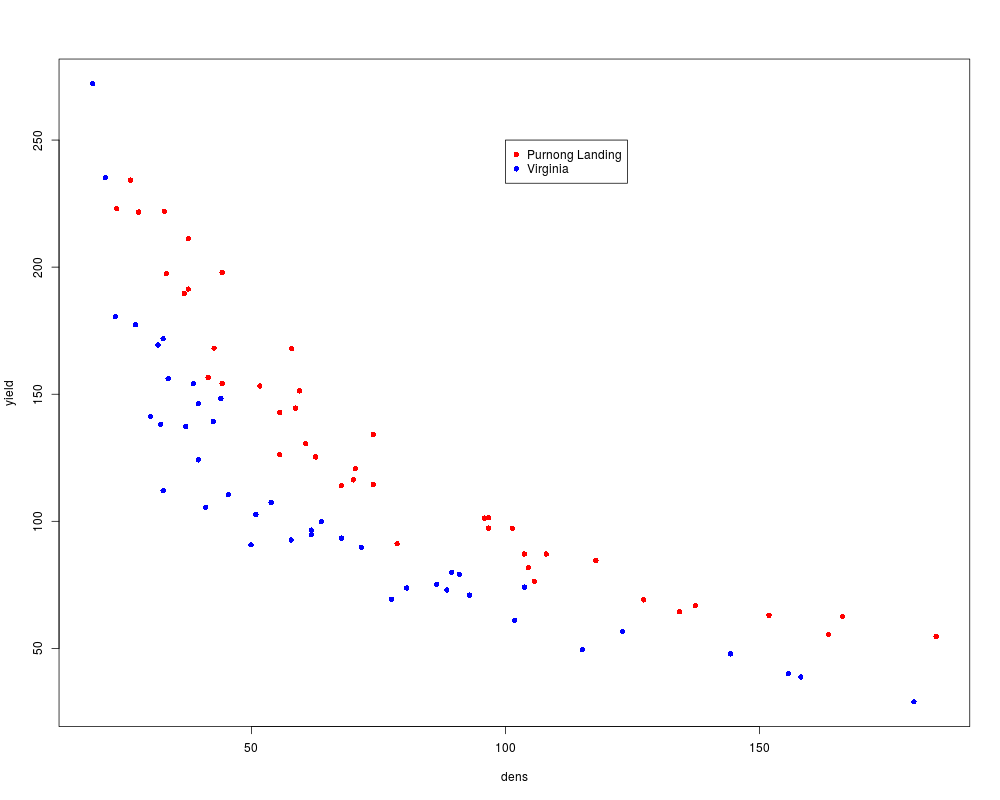
points.cols <- c("red","blue")
plot(dens,yield,col=points.cols[location+1],pch=16)
legend(100,250,c("Purnong Landing","Virginia"),col=points.cols,pch=rep(16,2))
Results
R version 3.3.1 (2016-06-21) -- "Bug in Your Hair"
Copyright (C) 2016 The R Foundation for Statistical Computing
Platform: x86_64-pc-linux-gnu (64-bit)

R is free software and comes with ABSOLUTELY NO WARRANTY.
You are welcome to redistribute it under certain conditions.
Type 'license()' or 'licence()' for distribution details.

R is a collaborative project with many contributors.
Type 'contributors()' for more information and
'citation()' on how to cite R or R packages in publications.

Type 'demo()' for some demos, 'help()' for on-line help, or
'help.start()' for an HTML browser interface to help.
Type 'q()' to quit R.

> library(SemiPar)
> png(filename="/home/ddbj/snapshot/RGM3/R_CC/result/SemiPar/onions.Rd_%03d_medium.png", width=480, height=480)
> ### Name: onions
> ### Title: Onions data
> ### Aliases: onions
> ### Keywords: datasets
>
> ### ** Examples
>
> library(SemiPar)
> data(onions)
> attach(onions)
> points.cols <- c("red","blue")
> plot(dens,yield,col=points.cols[location+1],pch=16)
> legend(100,250,c("Purnong Landing","Virginia"),col=points.cols,pch=rep(16,2))
>
>
>
>
>
> dev.off()
null device
          1
>
|
Created & Maintained by Osamu Ogasawara (osamu.ogasawara@gmail.com) and 