Supported by Dr. Osamu Ogasawara and  . . |
|
Last data update: 2014.03.03 |
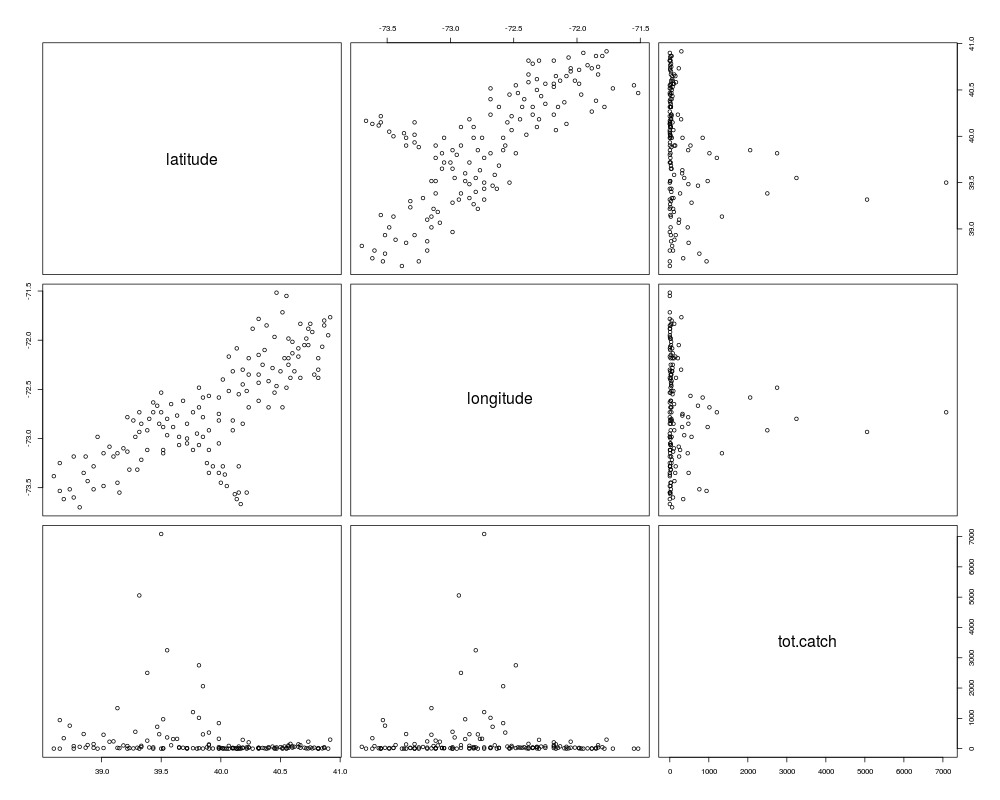
Scallop abundance dataDescriptionThe Usagedata(scallop) FormatThis data frame contains the following columns:
SourceEcker, M.D. and Heltshe, J.F. (1994). Geostatistical estimates of scallop abundance. In Case Studies in Biometry. Lange, N., Ryan, L., Billard, L., Brillinger, D., Conquest, L. and Greenhouse, J. (eds.) New York: John Wiley & Sons, 107-124. ReferencesRuppert, D., Wand, M.P. and Carroll, R.J. (2003) Exampleslibrary(SemiPar) data(scallop) pairs(scallop) Results
R version 3.3.1 (2016-06-21) -- "Bug in Your Hair"
Copyright (C) 2016 The R Foundation for Statistical Computing
Platform: x86_64-pc-linux-gnu (64-bit)

R is free software and comes with ABSOLUTELY NO WARRANTY.
You are welcome to redistribute it under certain conditions.
Type 'license()' or 'licence()' for distribution details.

R is a collaborative project with many contributors.
Type 'contributors()' for more information and
'citation()' on how to cite R or R packages in publications.

Type 'demo()' for some demos, 'help()' for on-line help, or
'help.start()' for an HTML browser interface to help.
Type 'q()' to quit R.

> library(SemiPar)
> png(filename="/home/ddbj/snapshot/RGM3/R_CC/result/SemiPar/scallop.Rd_%03d_medium.png", width=480, height=480)
> ### Name: scallop
> ### Title: Scallop abundance data
> ### Aliases: scallop
> ### Keywords: datasets
>
> ### ** Examples
>
> library(SemiPar)
> data(scallop)
> pairs(scallop)
>
>
>
>
>
> dev.off()
null device
          1
>
|