Supported by Dr. Osamu Ogasawara and  . . |
|
Last data update: 2014.03.03 |
U.S. temperature dataDescriptionThe Usagedata(ustemp) FormatThis data frame contains the following columns:
SourcePeixoto, J.L. (1990). A property of well-formulated polynomial regression models. American Statistician, 44, 26-30. ReferencesRuppert, D., Wand, M.P. and Carroll, R.J. (2003) Examples
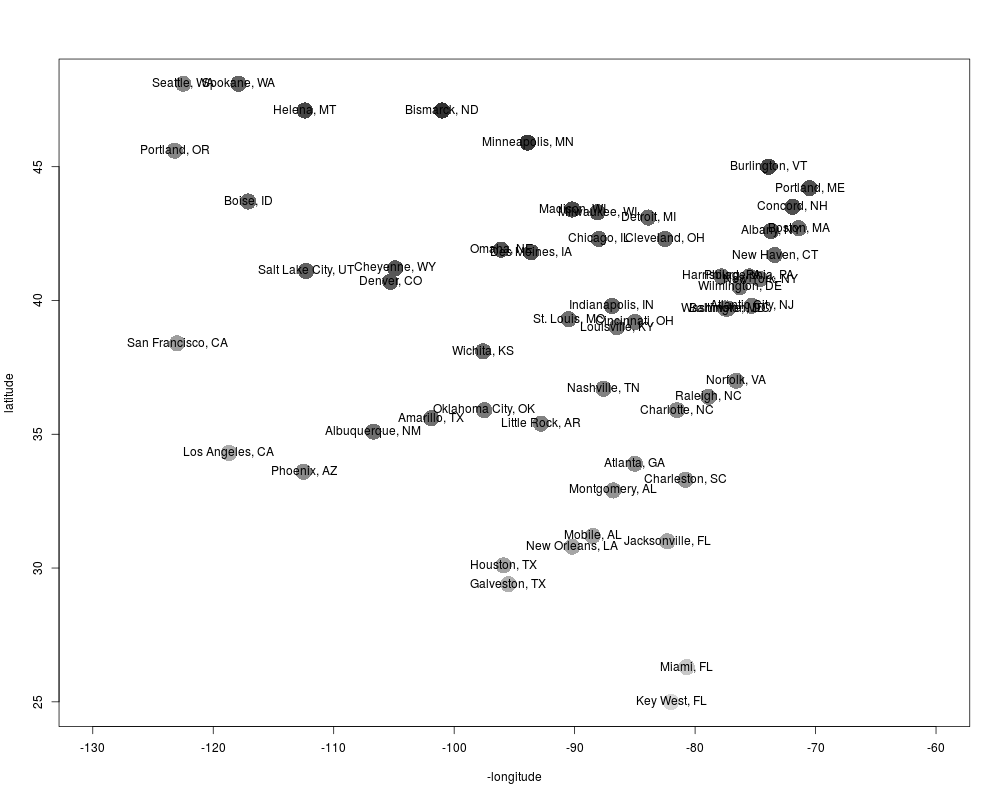
library(SemiPar)
data(ustemp)
attach(ustemp)
grey.levs <- min.temp+20
col.vec <- paste("grey",as.character(grey.levs),sep="")
plot(-longitude,latitude,col=col.vec,pch=16,cex=3,xlim=c(-130,-60))
text(-longitude,latitude,as.character(city))
Results
R version 3.3.1 (2016-06-21) -- "Bug in Your Hair"
Copyright (C) 2016 The R Foundation for Statistical Computing
Platform: x86_64-pc-linux-gnu (64-bit)

R is free software and comes with ABSOLUTELY NO WARRANTY.
You are welcome to redistribute it under certain conditions.
Type 'license()' or 'licence()' for distribution details.

R is a collaborative project with many contributors.
Type 'contributors()' for more information and
'citation()' on how to cite R or R packages in publications.

Type 'demo()' for some demos, 'help()' for on-line help, or
'help.start()' for an HTML browser interface to help.
Type 'q()' to quit R.

> library(SemiPar)
> png(filename="/home/ddbj/snapshot/RGM3/R_CC/result/SemiPar/ustemp.Rd_%03d_medium.png", width=480, height=480)
> ### Name: ustemp
> ### Title: U.S. temperature data
> ### Aliases: ustemp
> ### Keywords: datasets
>
> ### ** Examples
>
> library(SemiPar)
> data(ustemp)
> attach(ustemp)
> grey.levs <- min.temp+20
> col.vec <- paste("grey",as.character(grey.levs),sep="")
> plot(-longitude,latitude,col=col.vec,pch=16,cex=3,xlim=c(-130,-60))
> text(-longitude,latitude,as.character(city))
>
>
>
>
>
> dev.off()
null device
          1
>
|
Created & Maintained by Osamu Ogasawara (osamu.ogasawara@gmail.com) and 