Supported by Dr. Osamu Ogasawara and  . . |
|
Last data update: 2014.03.03 |
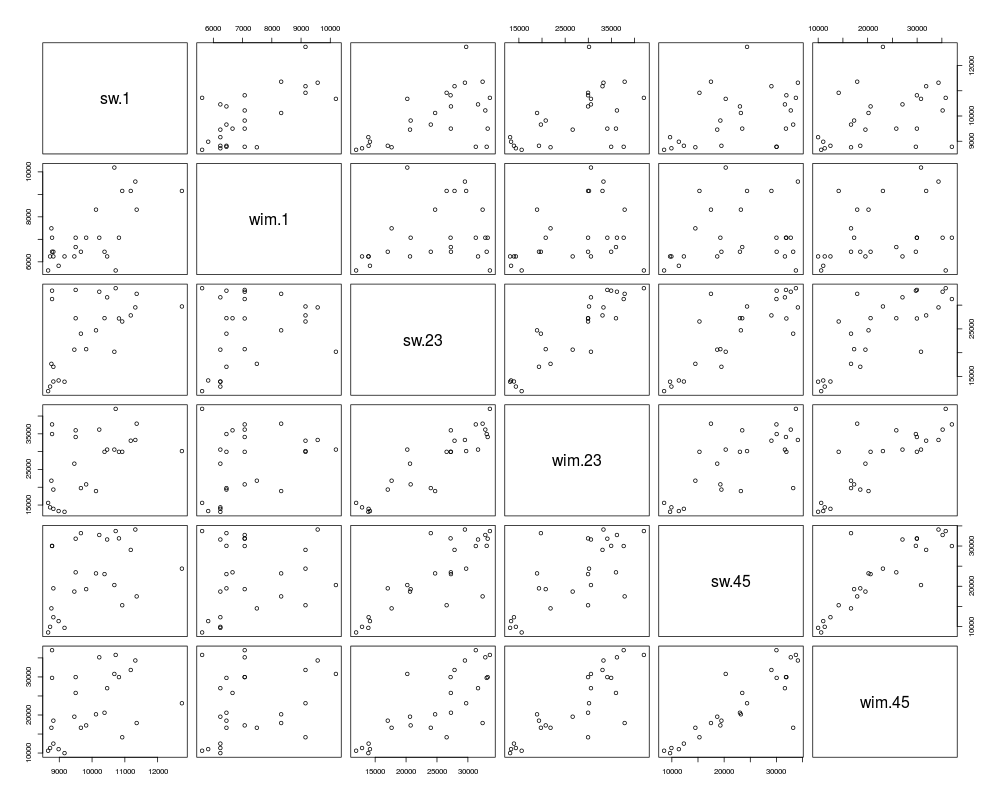
Data on Static Weights and Weight in Motion of TrucksDescriptionThe Usagedata(E7.5) FormatThis data frame contains the following columns:
DetailsTrucks can be weighted by two methods. In one, a truck needs to go into a
weighting station and each axle is weighted by conventional means. The
other is newer and a somewhat experimental method where a thin pad is placed
on the highway and axles are weighted as trucks pass over it. Former weight
are called static weights ( SourceSaleh Mumayiz, Urban Transportation Center, University of Illinois at Chicago, who compiled the data from a data set provided by the Illinois Department of Transportation. Examplesdata(E7.5) summary(E7.5) plot(E7.5) Results
R version 3.3.1 (2016-06-21) -- "Bug in Your Hair"
Copyright (C) 2016 The R Foundation for Statistical Computing
Platform: x86_64-pc-linux-gnu (64-bit)

R is free software and comes with ABSOLUTELY NO WARRANTY.
You are welcome to redistribute it under certain conditions.
Type 'license()' or 'licence()' for distribution details.

R is a collaborative project with many contributors.
Type 'contributors()' for more information and
'citation()' on how to cite R or R packages in publications.

Type 'demo()' for some demos, 'help()' for on-line help, or
'help.start()' for an HTML browser interface to help.
Type 'q()' to quit R.

> library(SenSrivastava)
> png(filename="/home/ddbj/snapshot/RGM3/R_CC/result/SenSrivastava/E7.5.Rd_%03d_medium.png", width=480, height=480)
> ### Name: E7.5
> ### Title: Data on Static Weights and Weight in Motion of Trucks
> ### Aliases: E7.5
> ### Keywords: datasets
>
> ### ** Examples
>
> data(E7.5)
> summary(E7.5)
      sw.1           wim.1           sw.23           wim.23
 Min.   : 8660   Min.   : 5616   Min.   :11920   Min.   :13104
 1st Qu.: 8860   1st Qu.: 6240   1st Qu.:18295   1st Qu.:19448
 Median : 9740   Median : 6864   Median :26880   Median :29952
 Mean   : 9936   Mean   : 7208   Mean   :24425   Mean   :27072
 3rd Qu.:10710   3rd Qu.: 8112   3rd Qu.:30890   3rd Qu.:33904
 Max.   :12740   Max.   :10192   Max.   :33560   Max.   :42016
     sw.45           wim.45
 Min.   : 8520   Min.   : 9984
 1st Qu.:15830   1st Qu.:16640
 Median :23110   Median :20384
 Mean   :22653   Mean   :22588
 3rd Qu.:31225   3rd Qu.:29952
 Max.   :34100   Max.   :37024
> plot(E7.5)
>
>
>
>
>
> dev.off()
null device
          1
>
|