Supported by Dr. Osamu Ogasawara and  . . |
|
Last data update: 2014.03.03 |
Stadium Cleanup DataDescriptionThe Usagedata(E9.20) FormatThis data frame contains the following columns:
SourceThe authors of the book. Examplesdata(E9.20) summary(E9.20) plot(E9.20) Results
R version 3.3.1 (2016-06-21) -- "Bug in Your Hair"
Copyright (C) 2016 The R Foundation for Statistical Computing
Platform: x86_64-pc-linux-gnu (64-bit)
R is free software and comes with ABSOLUTELY NO WARRANTY.
You are welcome to redistribute it under certain conditions.
Type 'license()' or 'licence()' for distribution details.
R is a collaborative project with many contributors.
Type 'contributors()' for more information and
'citation()' on how to cite R or R packages in publications.
Type 'demo()' for some demos, 'help()' for on-line help, or
'help.start()' for an HTML browser interface to help.
Type 'q()' to quit R.
> library(SenSrivastava)
> png(filename="/home/ddbj/snapshot/RGM3/R_CC/result/SenSrivastava/E9.20.Rd_%03d_medium.png", width=480, height=480)
> ### Name: E9.20
> ### Title: Stadium Cleanup Data
> ### Aliases: E9.20
> ### Keywords: datasets
>
> ### ** Examples
>
> data(E9.20)
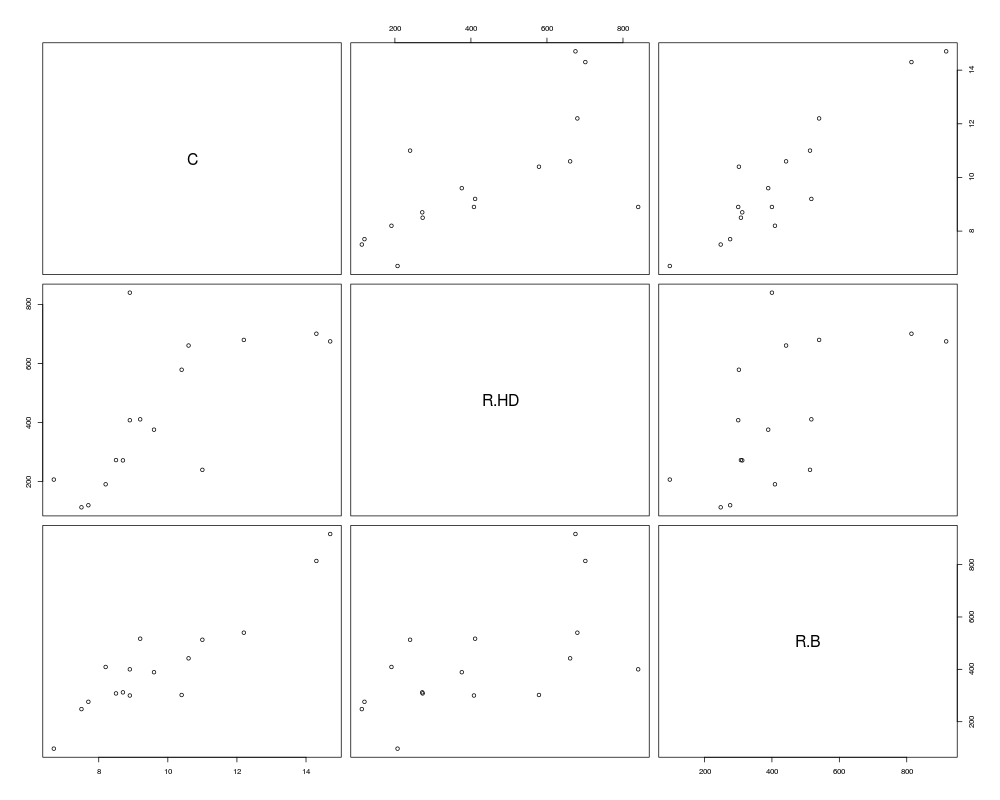
> summary(E9.20)
C R.HD R.B
Min. : 6.700 Min. :113.0 Min. : 97.0
1st Qu.: 8.425 1st Qu.:231.8 1st Qu.:301.5
Median : 9.050 Median :392.0 Median :394.5
Mean : 9.819 Mean :421.7 Mean :424.0
3rd Qu.:10.700 3rd Qu.:664.5 3rd Qu.:514.0
Max. :14.700 Max. :840.0 Max. :917.0
> plot(E9.20)
>
>
>
>
>
> dev.off()
null device
1
>
|
Created & Maintained by Osamu Ogasawara (osamu.ogasawara@gmail.com) and 