Supported by Dr. Osamu Ogasawara and  . . |
|
Last data update: 2014.03.03 |
Hair and Eye Color of Statistics StudentsDescriptionDistribution of hair and eye color and sex in 592 statistics students. UsageHairEyeColor FormatA 3-dimensional array resulting from cross-tabulating 592 observations on 3 variables. The variables and their levels are as follows:
DetailsThe Hair x Eye table comes rom a survey of students at
the University of Delaware reported by Snee (1974). The split by
This data set is useful for illustrating various techniques for the analysis of contingency tables, such as the standard chi-squared test or, more generally, log-linear modelling, and graphical methods such as mosaic plots, sieve diagrams or association plots. Sourcehttp://euclid.psych.yorku.ca/ftp/sas/vcd/catdata/haireye.sas Snee (1974) gives the two-way table aggregated over ReferencesSnee, R. D. (1974) Graphical display of two-way contingency tables. The American Statistician, 28, 9–12. Friendly, M. (1992a) Graphical methods for categorical data. SAS User Group International Conference Proceedings, 17, 190–200. http://www.math.yorku.ca/SCS/sugi/sugi17-paper.html Friendly, M. (1992b) Mosaic displays for loglinear models. Proceedings of the Statistical Graphics Section, American Statistical Association, pp. 61–68. http://www.math.yorku.ca/SCS/Papers/asa92.html Friendly, M. (2000) Visualizing Categorical Data. SAS Institute, ISBN 1-58025-660-0. See Also
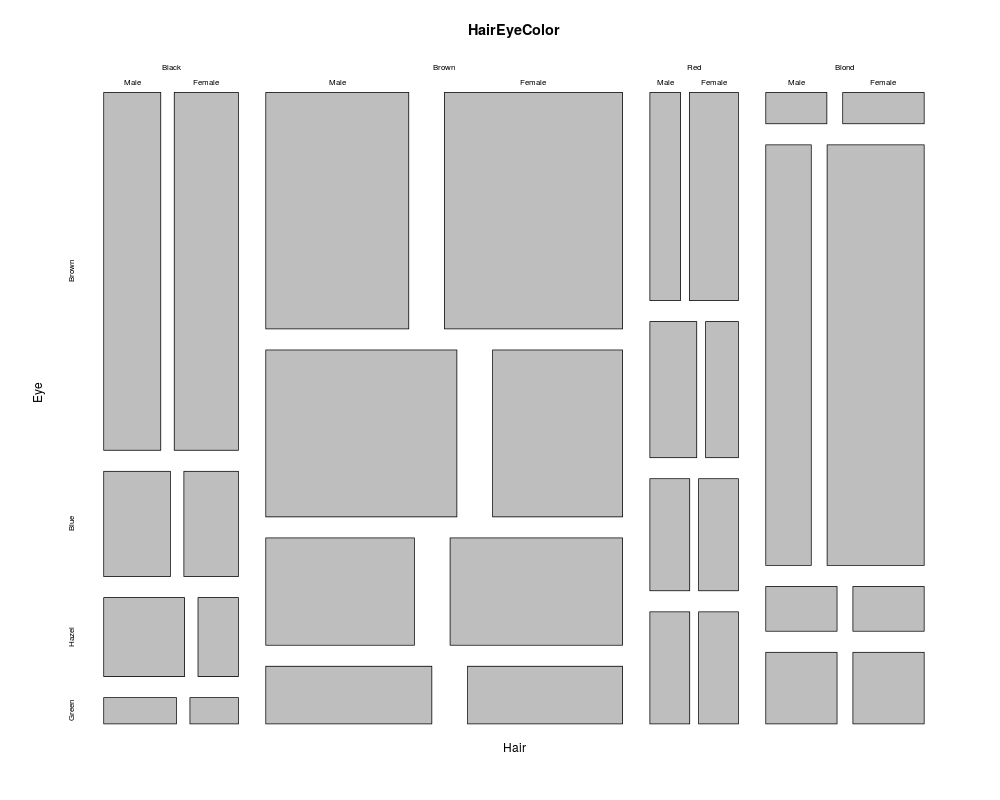
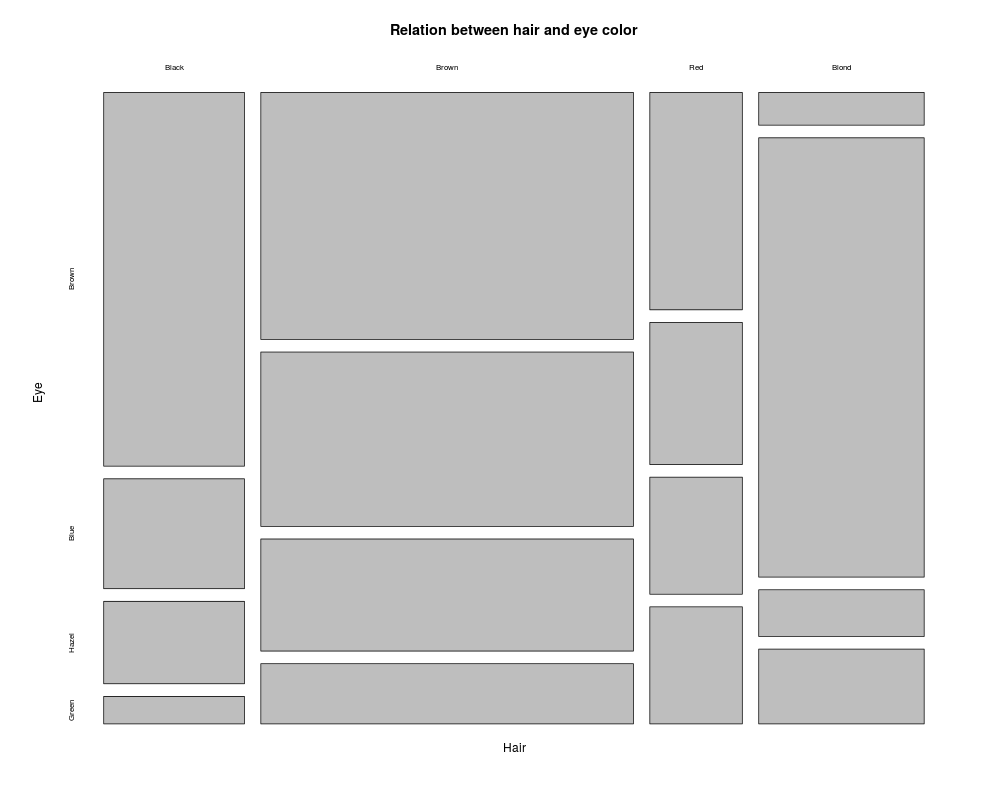
Examplesrequire(graphics) ## Full mosaic mosaicplot(HairEyeColor) ## Aggregate over sex (as in Snee's original data) x <- apply(HairEyeColor, c(1, 2), sum) x mosaicplot(x, main = "Relation between hair and eye color") Results
R version 3.3.1 (2016-06-21) -- "Bug in Your Hair"
Copyright (C) 2016 The R Foundation for Statistical Computing
Platform: x86_64-pc-linux-gnu (64-bit)

R is free software and comes with ABSOLUTELY NO WARRANTY.
You are welcome to redistribute it under certain conditions.
Type 'license()' or 'licence()' for distribution details.

R is a collaborative project with many contributors.
Type 'contributors()' for more information and
'citation()' on how to cite R or R packages in publications.

Type 'demo()' for some demos, 'help()' for on-line help, or
'help.start()' for an HTML browser interface to help.
Type 'q()' to quit R.

> library(datasets)
> png(filename="/home/ddbj/snapshot/RGM3/R_rel/result/datasets/HairEyeColor.Rd_%03d_medium.png", width=480, height=480)
> ### Name: HairEyeColor
> ### Title: Hair and Eye Color of Statistics Students
> ### Aliases: HairEyeColor
> ### Keywords: datasets
>
> ### ** Examples
>
> require(graphics)
> ## Full mosaic
> mosaicplot(HairEyeColor)
> ## Aggregate over sex (as in Snee's original data)
> x <- apply(HairEyeColor, c(1, 2), sum)
> x
       Eye
Hair    Brown Blue Hazel Green
  Black    68   20    15     5
  Brown   119   84    54    29
  Red      26   17    14    14
  Blond     7   94    10    16
> mosaicplot(x, main = "Relation between hair and eye color")
>
>
>
>
>
> dev.off()
null device
          1
>
|