Supported by Dr. Osamu Ogasawara and  . . |
|
Last data update: 2014.03.03 |
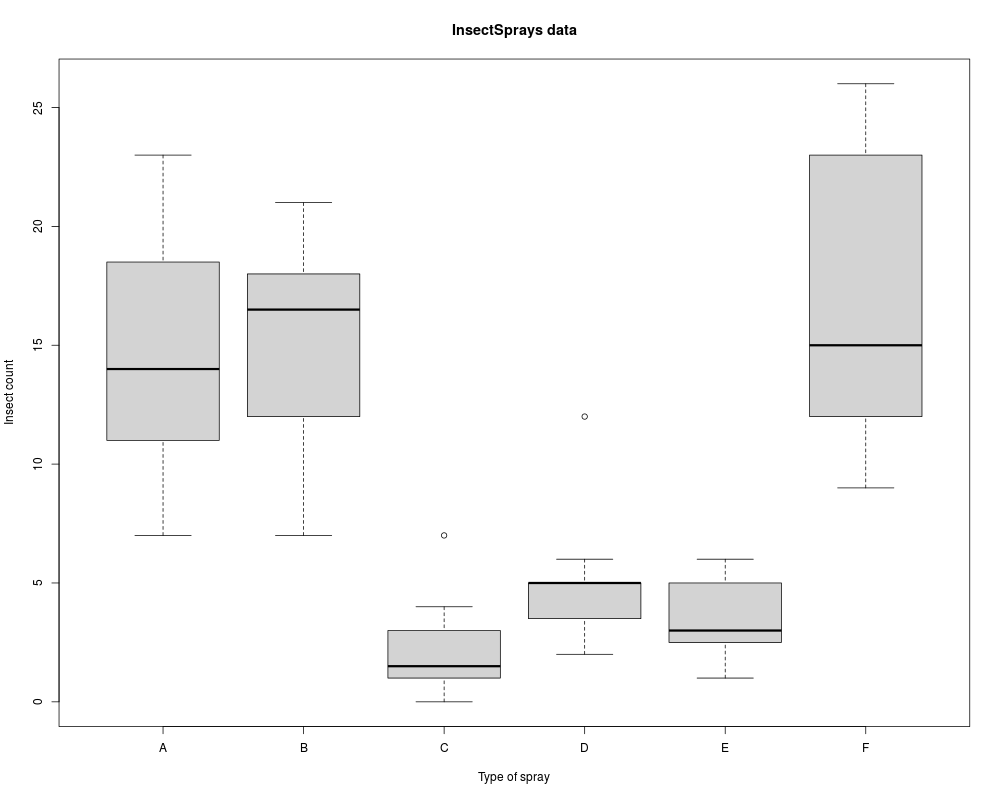
Effectiveness of Insect SpraysDescriptionThe counts of insects in agricultural experimental units treated with different insecticides. UsageInsectSprays FormatA data frame with 72 observations on 2 variables.
SourceBeall, G., (1942) The Transformation of data from entomological field experiments, Biometrika, 29, 243–262. ReferencesMcNeil, D. (1977) Interactive Data Analysis. New York: Wiley. Examples
require(stats); require(graphics)
boxplot(count ~ spray, data = InsectSprays,
xlab = "Type of spray", ylab = "Insect count",
main = "InsectSprays data", varwidth = TRUE, col = "lightgray")
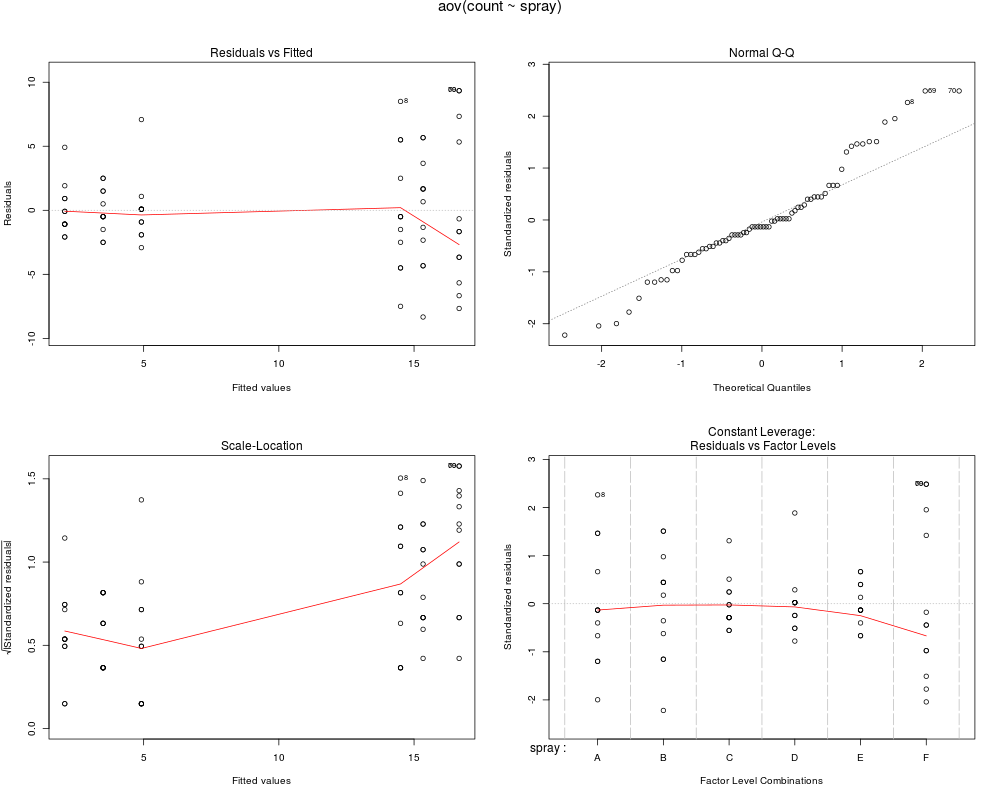
fm1 <- aov(count ~ spray, data = InsectSprays)
summary(fm1)
opar <- par(mfrow = c(2, 2), oma = c(0, 0, 1.1, 0))
plot(fm1)
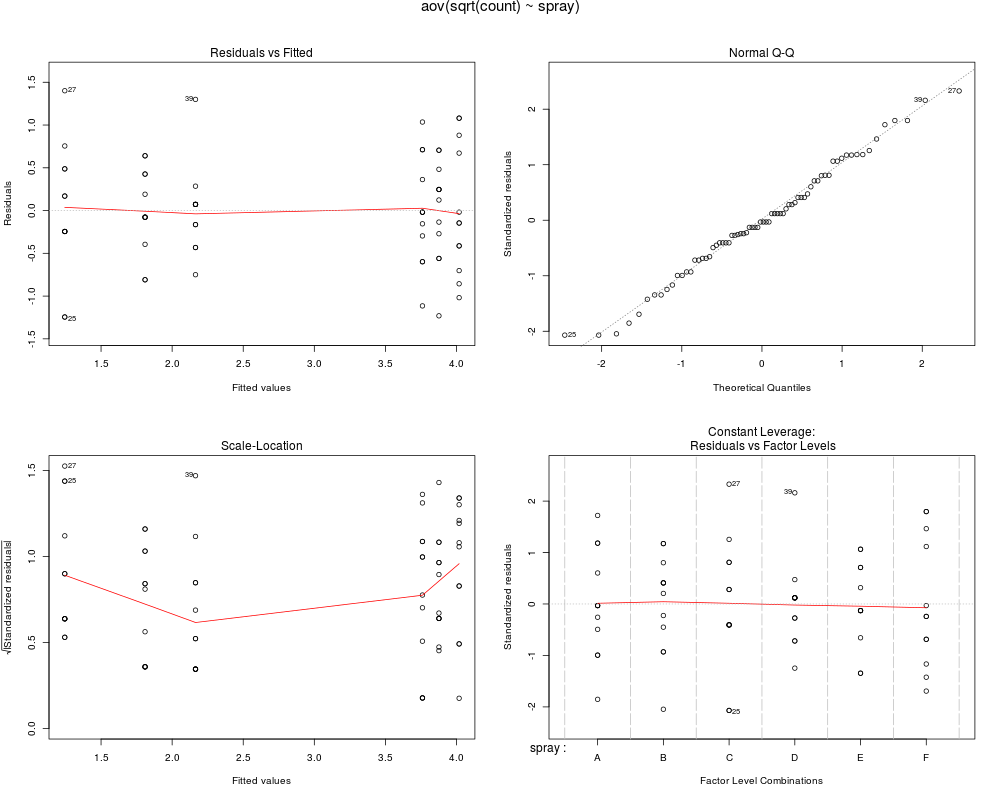
fm2 <- aov(sqrt(count) ~ spray, data = InsectSprays)
summary(fm2)
plot(fm2)
par(opar)
Results
R version 3.3.1 (2016-06-21) -- "Bug in Your Hair"
Copyright (C) 2016 The R Foundation for Statistical Computing
Platform: x86_64-pc-linux-gnu (64-bit)

R is free software and comes with ABSOLUTELY NO WARRANTY.
You are welcome to redistribute it under certain conditions.
Type 'license()' or 'licence()' for distribution details.

R is a collaborative project with many contributors.
Type 'contributors()' for more information and
'citation()' on how to cite R or R packages in publications.

Type 'demo()' for some demos, 'help()' for on-line help, or
'help.start()' for an HTML browser interface to help.
Type 'q()' to quit R.

> library(datasets)
> png(filename="/home/ddbj/snapshot/RGM3/R_rel/result/datasets/InsectSprays.Rd_%03d_medium.png", width=480, height=480)
> ### Name: InsectSprays
> ### Title: Effectiveness of Insect Sprays
> ### Aliases: InsectSprays
> ### Keywords: datasets
>
> ### ** Examples
>
> require(stats); require(graphics)
> boxplot(count ~ spray, data = InsectSprays,
+         xlab = "Type of spray", ylab = "Insect count",
+         main = "InsectSprays data", varwidth = TRUE, col = "lightgray")
> fm1 <- aov(count ~ spray, data = InsectSprays)
> summary(fm1)
            Df Sum Sq Mean Sq F value Pr(>F)
spray        5   2669   533.8    34.7 <2e-16 ***
Residuals   66   1015    15.4
---
Signif. codes:  0 '***' 0.001 '**' 0.01 '*' 0.05 '.' 0.1 ' ' 1
> opar <- par(mfrow = c(2, 2), oma = c(0, 0, 1.1, 0))
> plot(fm1)
> fm2 <- aov(sqrt(count) ~ spray, data = InsectSprays)
> summary(fm2)
            Df Sum Sq Mean Sq F value Pr(>F)
spray        5  88.44  17.688    44.8 <2e-16 ***
Residuals   66  26.06   0.395
---
Signif. codes:  0 '***' 0.001 '**' 0.01 '*' 0.05 '.' 0.1 ' ' 1
> plot(fm2)
> par(opar)
>
>
>
>
>
> dev.off()
null device
          1
>
|
Created & Maintained by Osamu Ogasawara (osamu.ogasawara@gmail.com) and 