Supported by Dr. Osamu Ogasawara and  . . |
|
Last data update: 2014.03.03 |
Growth of Orange TreesDescriptionThe UsageOrange FormatAn object of class
DetailsThis dataset was originally part of package SourceDraper, N. R. and Smith, H. (1998), Applied Regression Analysis (3rd ed), Wiley (exercise 24.N). Pinheiro, J. C. and Bates, D. M. (2000) Mixed-effects Models in S and S-PLUS, Springer. Examples
require(stats); require(graphics)
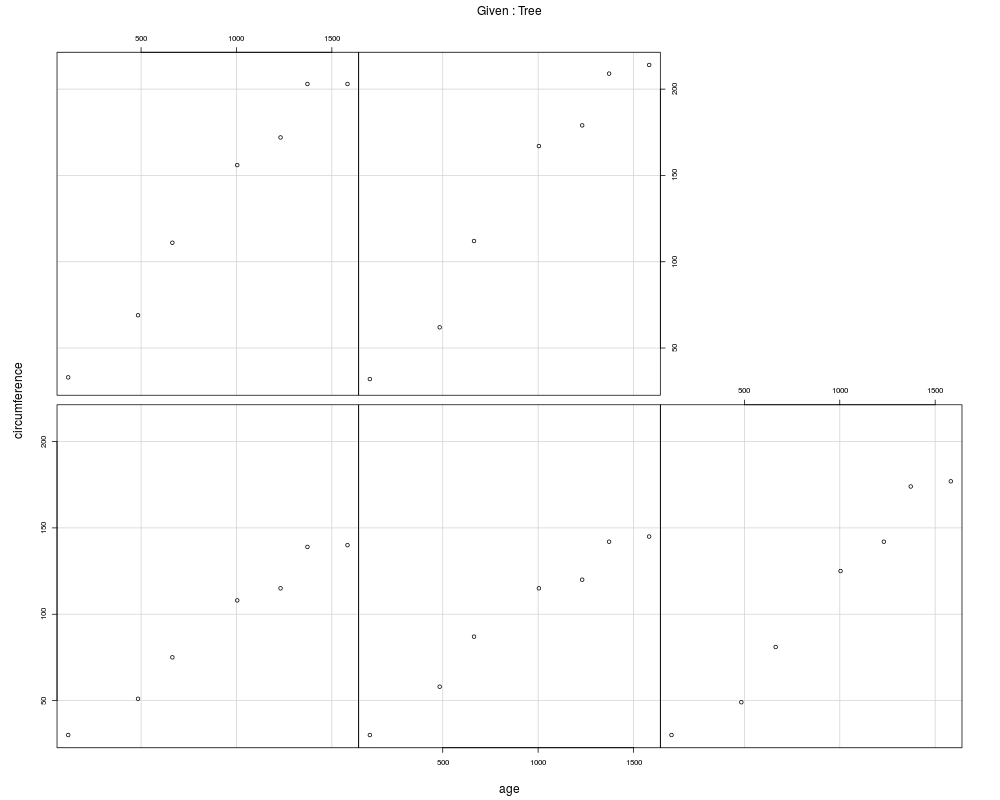
coplot(circumference ~ age | Tree, data = Orange, show.given = FALSE)
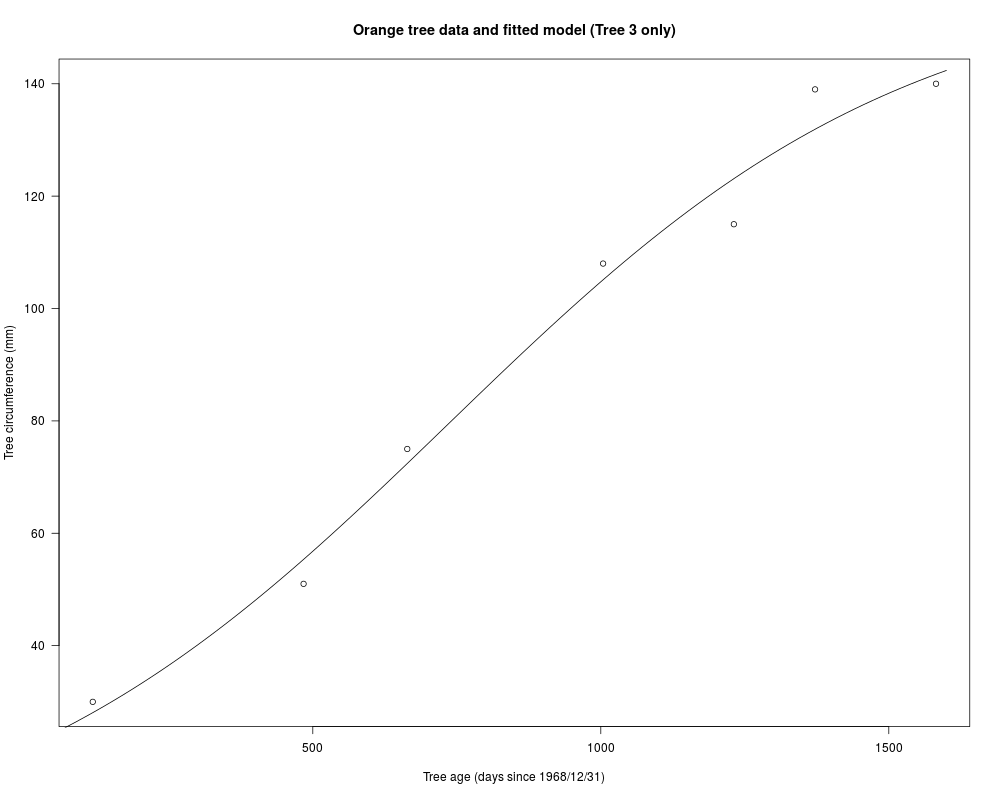
fm1 <- nls(circumference ~ SSlogis(age, Asym, xmid, scal),
data = Orange, subset = Tree == 3)
plot(circumference ~ age, data = Orange, subset = Tree == 3,
xlab = "Tree age (days since 1968/12/31)",
ylab = "Tree circumference (mm)", las = 1,
main = "Orange tree data and fitted model (Tree 3 only)")
age <- seq(0, 1600, length.out = 101)
lines(age, predict(fm1, list(age = age)))
Results
R version 3.3.1 (2016-06-21) -- "Bug in Your Hair"
Copyright (C) 2016 The R Foundation for Statistical Computing
Platform: x86_64-pc-linux-gnu (64-bit)

R is free software and comes with ABSOLUTELY NO WARRANTY.
You are welcome to redistribute it under certain conditions.
Type 'license()' or 'licence()' for distribution details.

R is a collaborative project with many contributors.
Type 'contributors()' for more information and
'citation()' on how to cite R or R packages in publications.

Type 'demo()' for some demos, 'help()' for on-line help, or
'help.start()' for an HTML browser interface to help.
Type 'q()' to quit R.

> library(datasets)
> png(filename="/home/ddbj/snapshot/RGM3/R_rel/result/datasets/Orange.Rd_%03d_medium.png", width=480, height=480)
> ### Name: Orange
> ### Title: Growth of Orange Trees
> ### Aliases: Orange
> ### Keywords: datasets
>
> ### ** Examples
>
> require(stats); require(graphics)
> coplot(circumference ~ age | Tree, data = Orange, show.given = FALSE)
> fm1 <- nls(circumference ~ SSlogis(age, Asym, xmid, scal),
+            data = Orange, subset = Tree == 3)
> plot(circumference ~ age, data = Orange, subset = Tree == 3,
+      xlab = "Tree age (days since 1968/12/31)",
+      ylab = "Tree circumference (mm)", las = 1,
+      main = "Orange tree data and fitted model (Tree 3 only)")
> age <- seq(0, 1600, length.out = 101)
> lines(age, predict(fm1, list(age = age)))
>
>
>
>
>
> dev.off()
null device
          1
>
|