Supported by Dr. Osamu Ogasawara and  . . |
|
Last data update: 2014.03.03 |
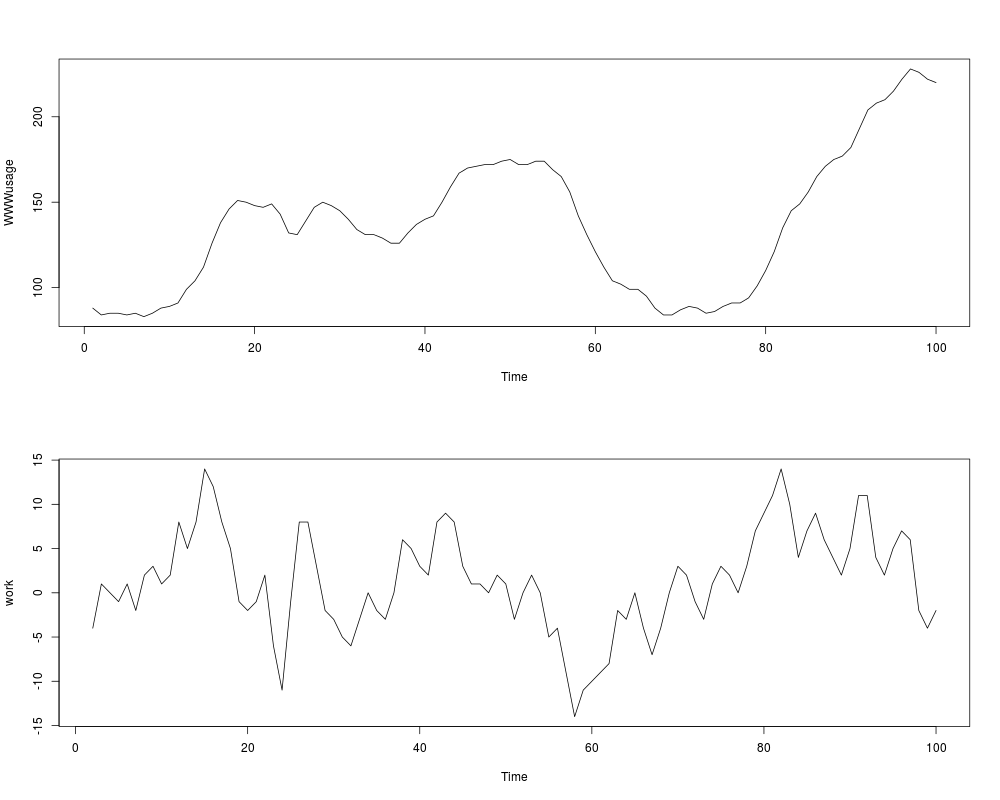
Internet Usage per MinuteDescriptionA time series of the numbers of users connected to the Internet through a server every minute. UsageWWWusage FormatA time series of length 100. SourceDurbin, J. and Koopman, S. J. (2001) Time Series Analysis by State Space Methods. Oxford University Press. http://www.ssfpack.com/dkbook/ ReferencesMakridakis, S., Wheelwright, S. C. and Hyndman, R. J. (1998) Forecasting: Methods and Applications. Wiley. Examples
require(graphics)
work <- diff(WWWusage)
par(mfrow = c(2, 1)); plot(WWWusage); plot(work)
## Not run:
require(stats)
aics <- matrix(, 6, 6, dimnames = list(p = 0:5, q = 0:5))
for(q in 1:5) aics[1, 1+q] <- arima(WWWusage, c(0, 1, q),
    optim.control = list(maxit = 500))$aic
for(p in 1:5)
   for(q in 0:5) aics[1+p, 1+q] <- arima(WWWusage, c(p, 1, q),
       optim.control = list(maxit = 500))$aic
round(aics - min(aics, na.rm = TRUE), 2)

## End(Not run)
Results
R version 3.3.1 (2016-06-21) -- "Bug in Your Hair"
Copyright (C) 2016 The R Foundation for Statistical Computing
Platform: x86_64-pc-linux-gnu (64-bit)

R is free software and comes with ABSOLUTELY NO WARRANTY.
You are welcome to redistribute it under certain conditions.
Type 'license()' or 'licence()' for distribution details.

R is a collaborative project with many contributors.
Type 'contributors()' for more information and
'citation()' on how to cite R or R packages in publications.

Type 'demo()' for some demos, 'help()' for on-line help, or
'help.start()' for an HTML browser interface to help.
Type 'q()' to quit R.

> library(datasets)
> png(filename="/home/ddbj/snapshot/RGM3/R_rel/result/datasets/WWWusage.Rd_%03d_medium.png", width=480, height=480)
> ### Name: WWWusage
> ### Title: Internet Usage per Minute
> ### Aliases: WWWusage
> ### Keywords: datasets
>
> ### ** Examples
>
> require(graphics)
> work <- diff(WWWusage)
> par(mfrow = c(2, 1)); plot(WWWusage); plot(work)
> ## Not run:
> ##D require(stats)
> ##D aics <- matrix(, 6, 6, dimnames = list(p = 0:5, q = 0:5))
> ##D for(q in 1:5) aics[1, 1+q] <- arima(WWWusage, c(0, 1, q),
> ##D     optim.control = list(maxit = 500))$aic
> ##D for(p in 1:5)
> ##D    for(q in 0:5) aics[1+p, 1+q] <- arima(WWWusage, c(p, 1, q),
> ##D        optim.control = list(maxit = 500))$aic
> ##D round(aics - min(aics, na.rm = TRUE), 2)
> ## End(Not run)
>
>
>
>
> dev.off()
null device
          1
>
|
Created & Maintained by Osamu Ogasawara (osamu.ogasawara@gmail.com) and 