Supported by Dr. Osamu Ogasawara and  . . |
|
Last data update: 2014.03.03 |
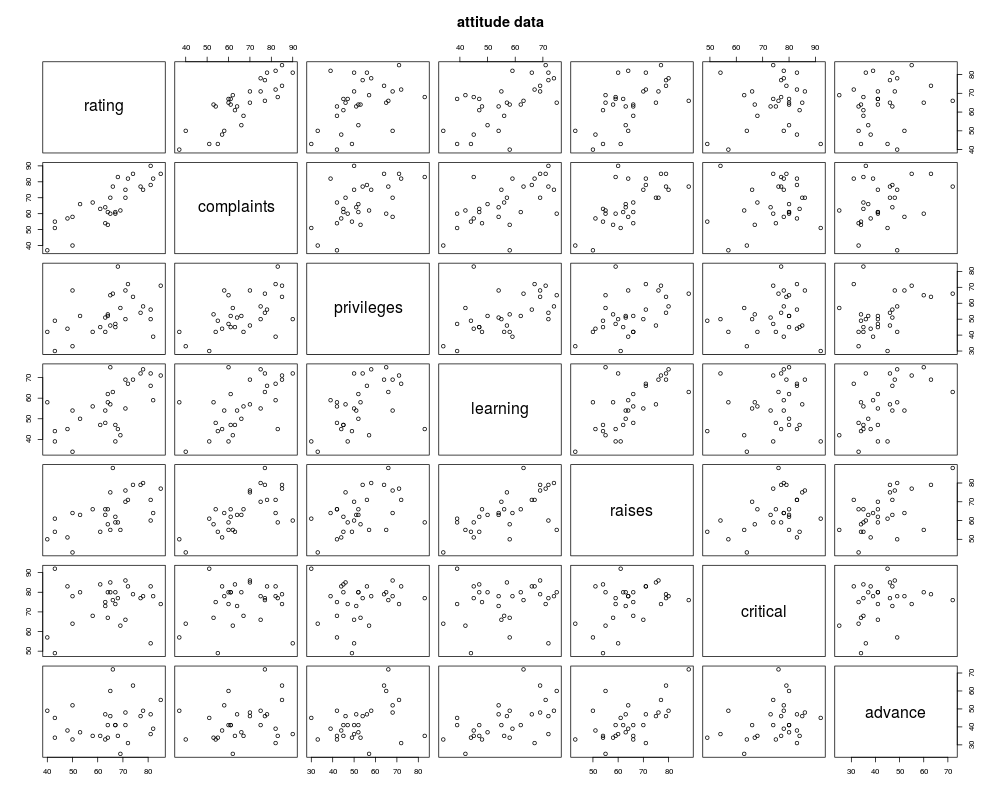
The Chatterjee–Price Attitude DataDescriptionFrom a survey of the clerical employees of a large financial organization, the data are aggregated from the questionnaires of the approximately 35 employees for each of 30 (randomly selected) departments. The numbers give the percent proportion of favourable responses to seven questions in each department. Usageattitude FormatA data frame with 30 observations on 7 variables. The first column are the short names from the reference, the second one the variable names in the data frame:
SourceChatterjee, S. and Price, B. (1977) Regression Analysis by Example. New York: Wiley. (Section 3.7, p.68ff of 2nd ed.(1991).) Examples
require(stats); require(graphics)
pairs(attitude, main = "attitude data")
summary(attitude)
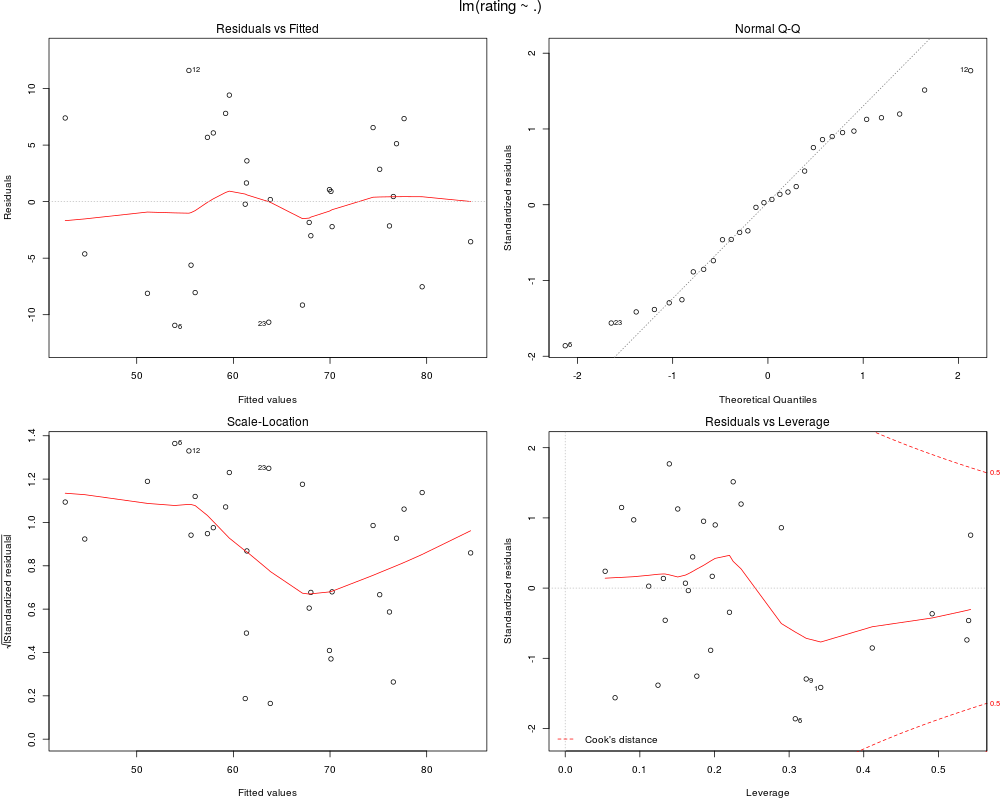
summary(fm1 <- lm(rating ~ ., data = attitude))
opar <- par(mfrow = c(2, 2), oma = c(0, 0, 1.1, 0),
mar = c(4.1, 4.1, 2.1, 1.1))
plot(fm1)
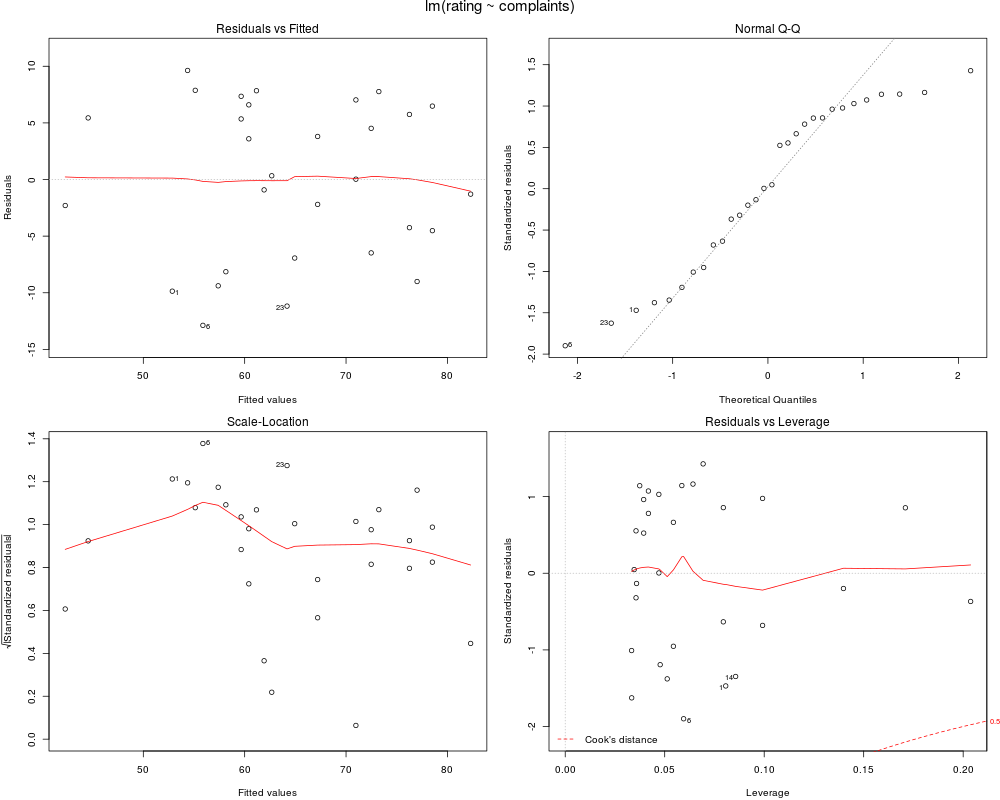
summary(fm2 <- lm(rating ~ complaints, data = attitude))
plot(fm2)
par(opar)
Results
R version 3.3.1 (2016-06-21) -- "Bug in Your Hair"
Copyright (C) 2016 The R Foundation for Statistical Computing
Platform: x86_64-pc-linux-gnu (64-bit)

R is free software and comes with ABSOLUTELY NO WARRANTY.
You are welcome to redistribute it under certain conditions.
Type 'license()' or 'licence()' for distribution details.

R is a collaborative project with many contributors.
Type 'contributors()' for more information and
'citation()' on how to cite R or R packages in publications.

Type 'demo()' for some demos, 'help()' for on-line help, or
'help.start()' for an HTML browser interface to help.
Type 'q()' to quit R.

> library(datasets)
> png(filename="/home/ddbj/snapshot/RGM3/R_rel/result/datasets/attitude.Rd_%03d_medium.png", width=480, height=480)
> ### Name: attitude
> ### Title: The Chatterjee-Price Attitude Data
> ### Aliases: attitude
> ### Keywords: datasets
>
> ### ** Examples
>
> require(stats); require(graphics)
> pairs(attitude, main = "attitude data")
> summary(attitude)
     rating        complaints     privileges       learning         raises
 Min.   :40.00   Min.   :37.0   Min.   :30.00   Min.   :34.00   Min.   :43.00
 1st Qu.:58.75   1st Qu.:58.5   1st Qu.:45.00   1st Qu.:47.00   1st Qu.:58.25
 Median :65.50   Median :65.0   Median :51.50   Median :56.50   Median :63.50
 Mean   :64.63   Mean   :66.6   Mean   :53.13   Mean   :56.37   Mean   :64.63
 3rd Qu.:71.75   3rd Qu.:77.0   3rd Qu.:62.50   3rd Qu.:66.75   3rd Qu.:71.00
 Max.   :85.00   Max.   :90.0   Max.   :83.00   Max.   :75.00   Max.   :88.00
    critical        advance
 Min.   :49.00   Min.   :25.00
 1st Qu.:69.25   1st Qu.:35.00
 Median :77.50   Median :41.00
 Mean   :74.77   Mean   :42.93
 3rd Qu.:80.00   3rd Qu.:47.75
 Max.   :92.00   Max.   :72.00
> summary(fm1 <- lm(rating ~ ., data = attitude))

Call:
lm(formula = rating ~ ., data = attitude)

Residuals:
     Min       1Q   Median       3Q      Max
-10.9418  -4.3555   0.3158   5.5425  11.5990

Coefficients:
            Estimate Std. Error t value Pr(>|t|)
(Intercept) 10.78708   11.58926   0.931 0.361634
complaints   0.61319    0.16098   3.809 0.000903 ***
privileges  -0.07305    0.13572  -0.538 0.595594
learning     0.32033    0.16852   1.901 0.069925 .
raises       0.08173    0.22148   0.369 0.715480
critical     0.03838    0.14700   0.261 0.796334
advance     -0.21706    0.17821  -1.218 0.235577
---
Signif. codes:  0 '***' 0.001 '**' 0.01 '*' 0.05 '.' 0.1 ' ' 1

Residual standard error: 7.068 on 23 degrees of freedom
Multiple R-squared:  0.7326,	Adjusted R-squared:  0.6628
F-statistic:  10.5 on 6 and 23 DF,  p-value: 1.24e-05

> opar <- par(mfrow = c(2, 2), oma = c(0, 0, 1.1, 0),
+             mar = c(4.1, 4.1, 2.1, 1.1))
> plot(fm1)
> summary(fm2 <- lm(rating ~ complaints, data = attitude))

Call:
lm(formula = rating ~ complaints, data = attitude)

Residuals:
     Min       1Q   Median       3Q      Max
-12.8799  -5.9905   0.1783   6.2978   9.6294

Coefficients:
            Estimate Std. Error t value Pr(>|t|)
(Intercept) 14.37632    6.61999   2.172   0.0385 *
complaints   0.75461    0.09753   7.737 1.99e-08 ***
---
Signif. codes:  0 '***' 0.001 '**' 0.01 '*' 0.05 '.' 0.1 ' ' 1

Residual standard error: 6.993 on 28 degrees of freedom
Multiple R-squared:  0.6813,	Adjusted R-squared:  0.6699
F-statistic: 59.86 on 1 and 28 DF,  p-value: 1.988e-08

> plot(fm2)
> par(opar)
>
>
>
>
>
> dev.off()
null device
          1
>
|
Created & Maintained by Osamu Ogasawara (osamu.ogasawara@gmail.com) and 