Supported by Dr. Osamu Ogasawara and  . . |
|
Last data update: 2014.03.03 |
Old Faithful Geyser DataDescriptionWaiting time between eruptions and the duration of the eruption for the Old Faithful geyser in Yellowstone National Park, Wyoming, USA. Usagefaithful FormatA data frame with 272 observations on 2 variables.
DetailsA closer look at There are many versions of this dataset around: Azzalini and Bowman (1990) use a more complete version. SourceW. Härdle. ReferencesHärdle, W. (1991) Smoothing Techniques with Implementation in S. New York: Springer. Azzalini, A. and Bowman, A. W. (1990). A look at some data on the Old Faithful geyser. Applied Statistics 39, 357–365. See Also
Examples
require(stats); require(graphics)
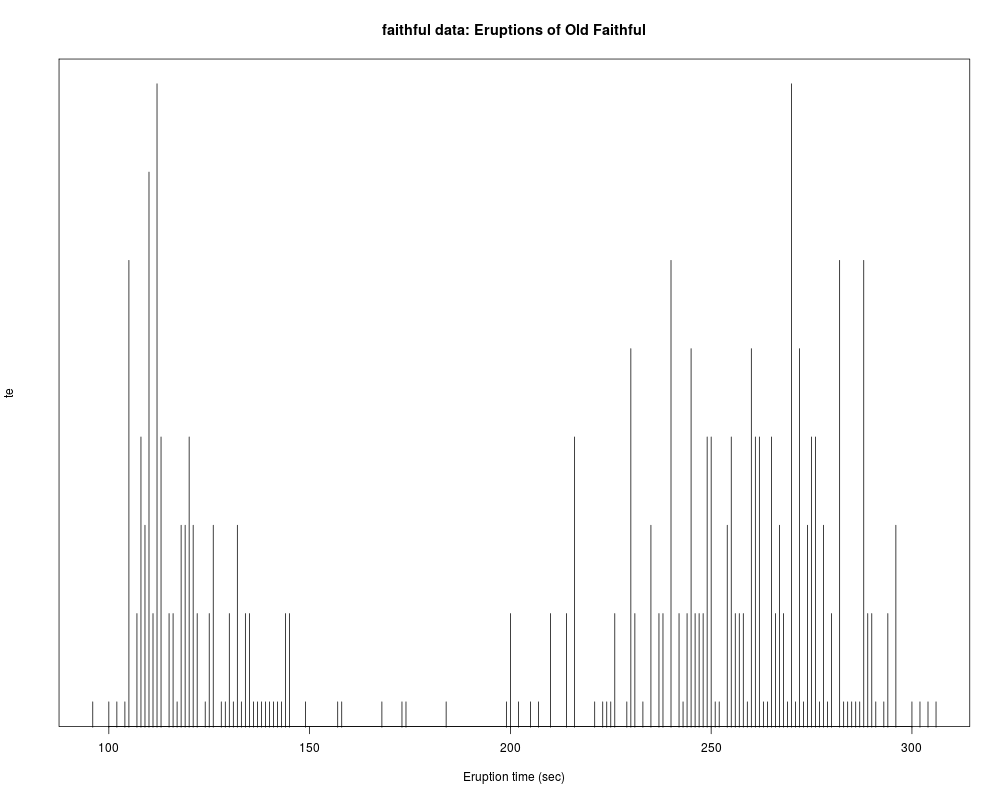
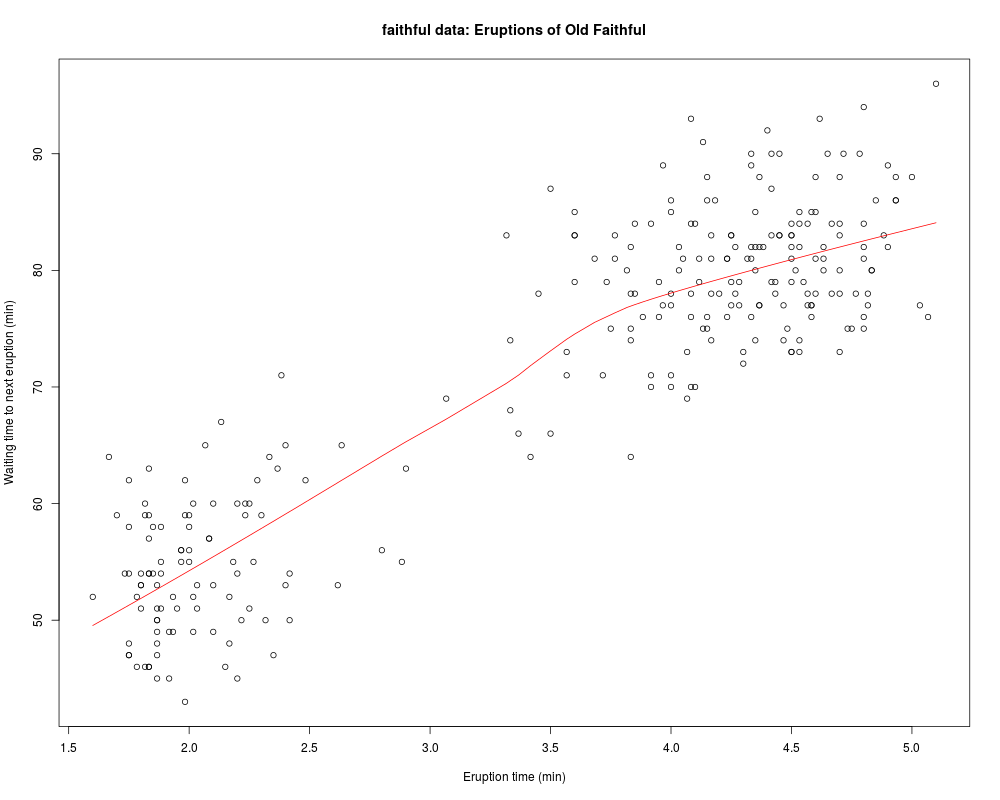
f.tit <- "faithful data: Eruptions of Old Faithful"
ne60 <- round(e60 <- 60 * faithful$eruptions)
all.equal(e60, ne60) # relative diff. ~ 1/10000
table(zapsmall(abs(e60 - ne60))) # 0, 0.02 or 0.04
faithful$better.eruptions <- ne60 / 60
te <- table(ne60)
te[te >= 4] # (too) many multiples of 5 !
plot(names(te), te, type = "h", main = f.tit, xlab = "Eruption time (sec)")
plot(faithful[, -3], main = f.tit,
xlab = "Eruption time (min)",
ylab = "Waiting time to next eruption (min)")
lines(lowess(faithful$eruptions, faithful$waiting, f = 2/3, iter = 3),
col = "red")
Results
R version 3.3.1 (2016-06-21) -- "Bug in Your Hair"
Copyright (C) 2016 The R Foundation for Statistical Computing
Platform: x86_64-pc-linux-gnu (64-bit)

R is free software and comes with ABSOLUTELY NO WARRANTY.
You are welcome to redistribute it under certain conditions.
Type 'license()' or 'licence()' for distribution details.

R is a collaborative project with many contributors.
Type 'contributors()' for more information and
'citation()' on how to cite R or R packages in publications.

Type 'demo()' for some demos, 'help()' for on-line help, or
'help.start()' for an HTML browser interface to help.
Type 'q()' to quit R.

> library(datasets)
> png(filename="/home/ddbj/snapshot/RGM3/R_rel/result/datasets/faithful.Rd_%03d_medium.png", width=480, height=480)
> ### Name: faithful
> ### Title: Old Faithful Geyser Data
> ### Aliases: faithful
> ### Keywords: datasets
>
> ### ** Examples
>
> require(stats); require(graphics)
> f.tit <-  "faithful data: Eruptions of Old Faithful"
>
> ne60 <- round(e60 <- 60 * faithful$eruptions)
> all.equal(e60, ne60)             # relative diff. ~ 1/10000
[1] "Mean relative difference: 9.515332e-05"
> table(zapsmall(abs(e60 - ne60))) # 0, 0.02 or 0.04

   0 0.02 0.04
 106  163    3
> faithful$better.eruptions <- ne60 / 60
> te <- table(ne60)
> te[te >= 4]                      # (too) many multiples of 5 !
ne60
105 108 110 112 113 120 216 230 240 245 249 250 255 260 261 262 265 270 272 275
  6   4   7   8   4   4   4   5   6   5   4   4   4   5   4   4   4   8   5   4
276 282 288
  4   6   6
> plot(names(te), te, type = "h", main = f.tit, xlab = "Eruption time (sec)")
>
> plot(faithful[, -3], main = f.tit,
+      xlab = "Eruption time (min)",
+      ylab = "Waiting time to next eruption (min)")
> lines(lowess(faithful$eruptions, faithful$waiting, f = 2/3, iter = 3),
+       col = "red")
>
>
>
>
>
> dev.off()
null device
          1
>
|