Supported by Dr. Osamu Ogasawara and  . . |
|
Last data update: 2014.03.03 |
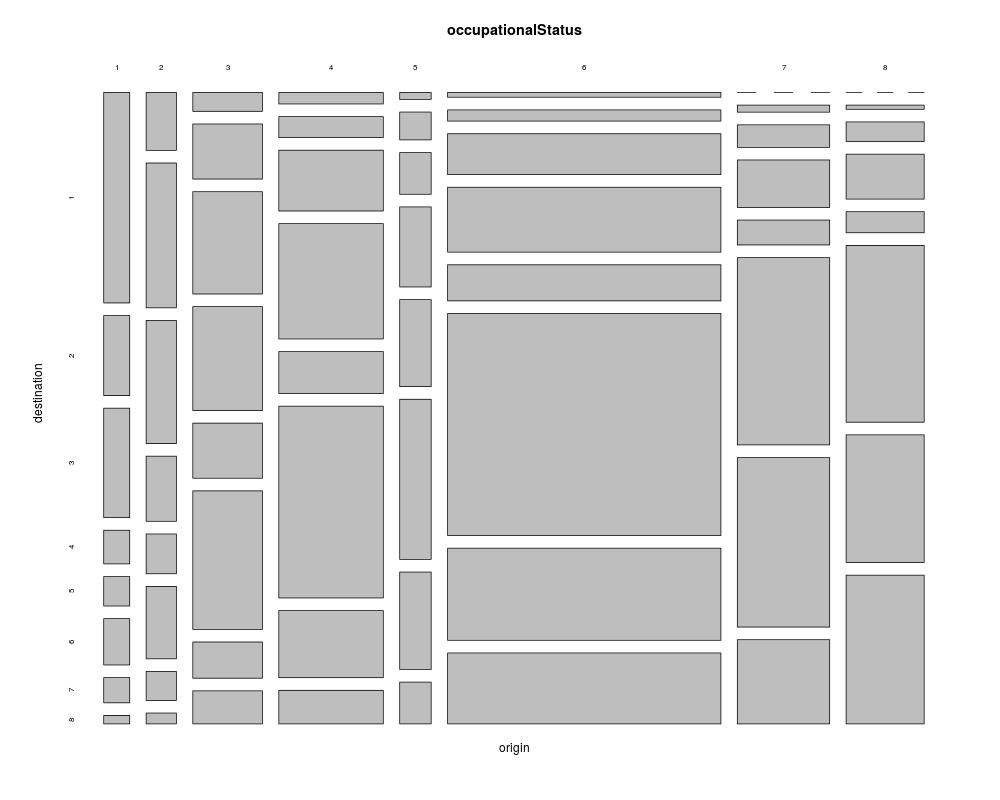
Occupational Status of Fathers and their SonsDescriptionCross-classification of a sample of British males according to each subject's occupational status and his father's occupational status. UsageoccupationalStatus FormatA SourceGoodman, L. A. (1979) Simple Models for the Analysis of Association in Cross-Classifications having Ordered Categories. J. Am. Stat. Assoc., 74 (367), 537–552. The data set has been in package gnm and been provided by the package authors. Examples
require(stats); require(graphics)
plot(occupationalStatus)
## Fit a uniform association model separating diagonal effects
Diag <- as.factor(diag(1:8))
Rscore <- scale(as.numeric(row(occupationalStatus)), scale = FALSE)
Cscore <- scale(as.numeric(col(occupationalStatus)), scale = FALSE)
modUnif <- glm(Freq ~ origin + destination + Diag + Rscore:Cscore,
family = poisson, data = occupationalStatus)
summary(modUnif)
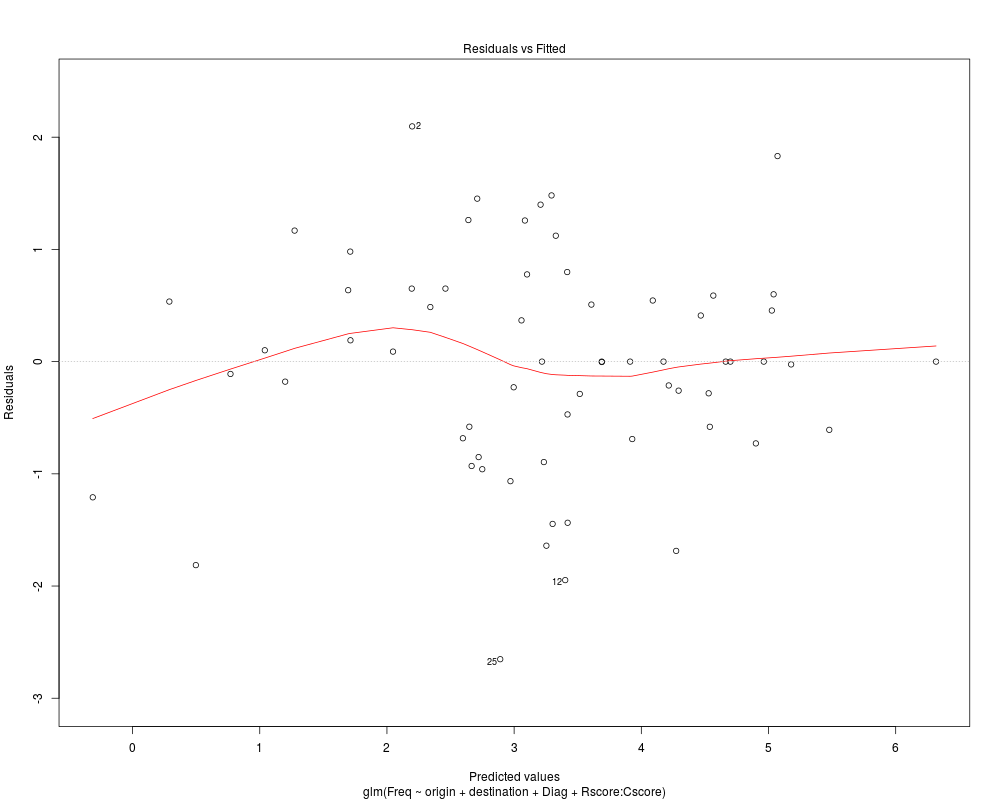
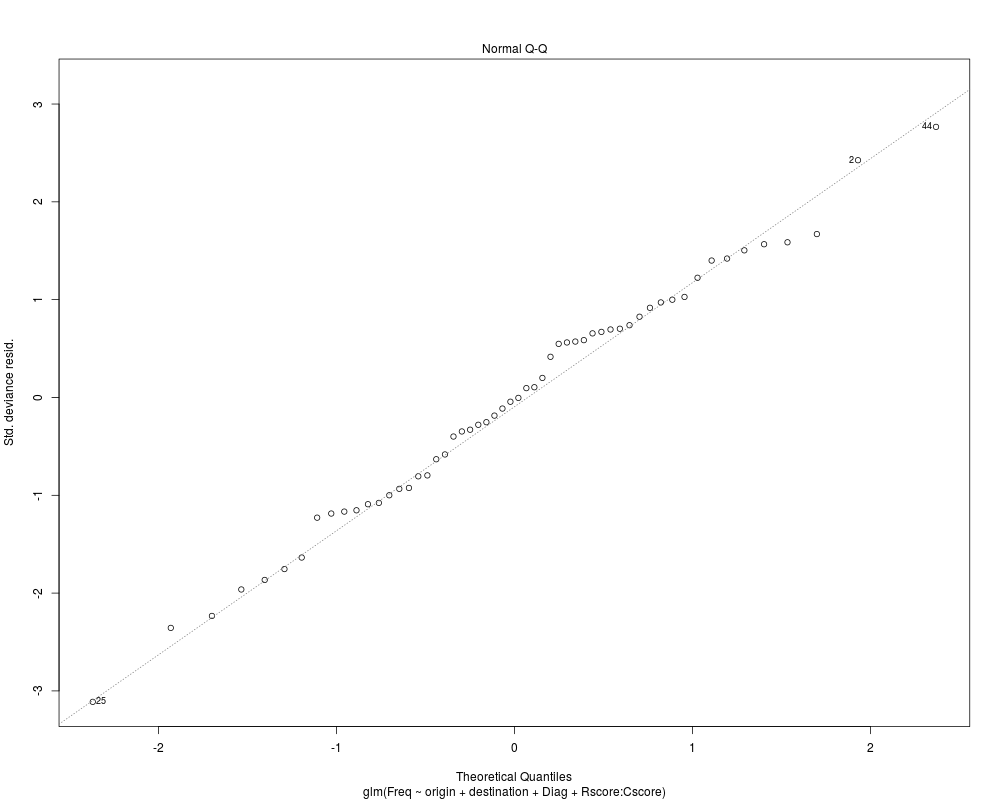
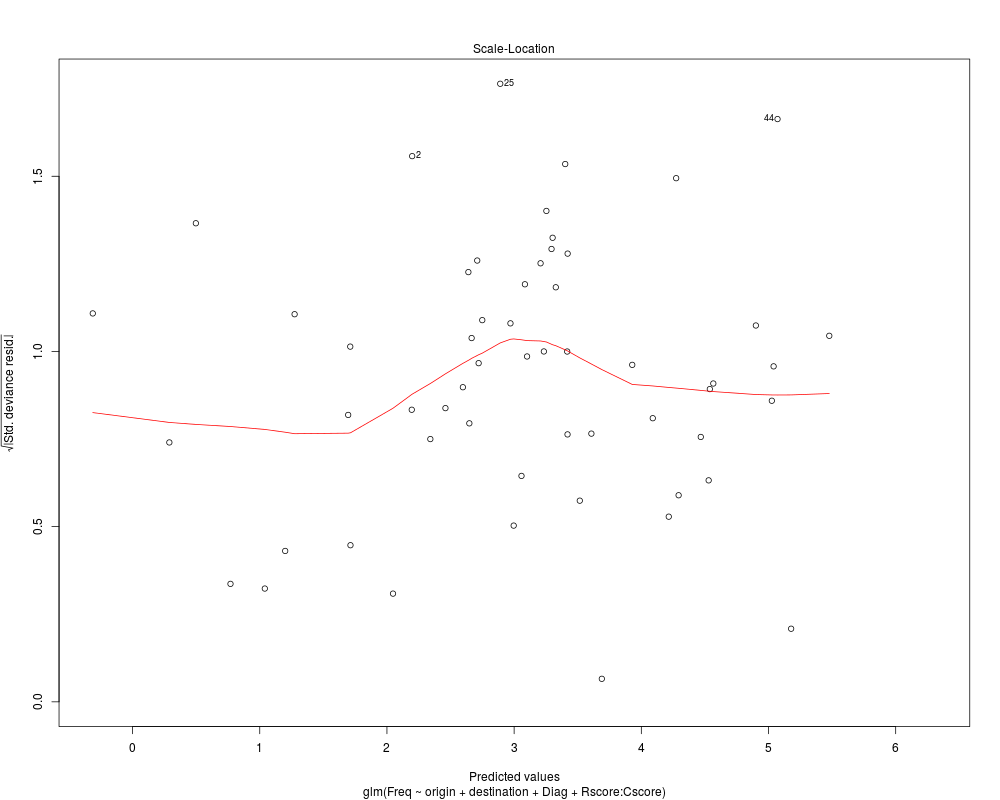
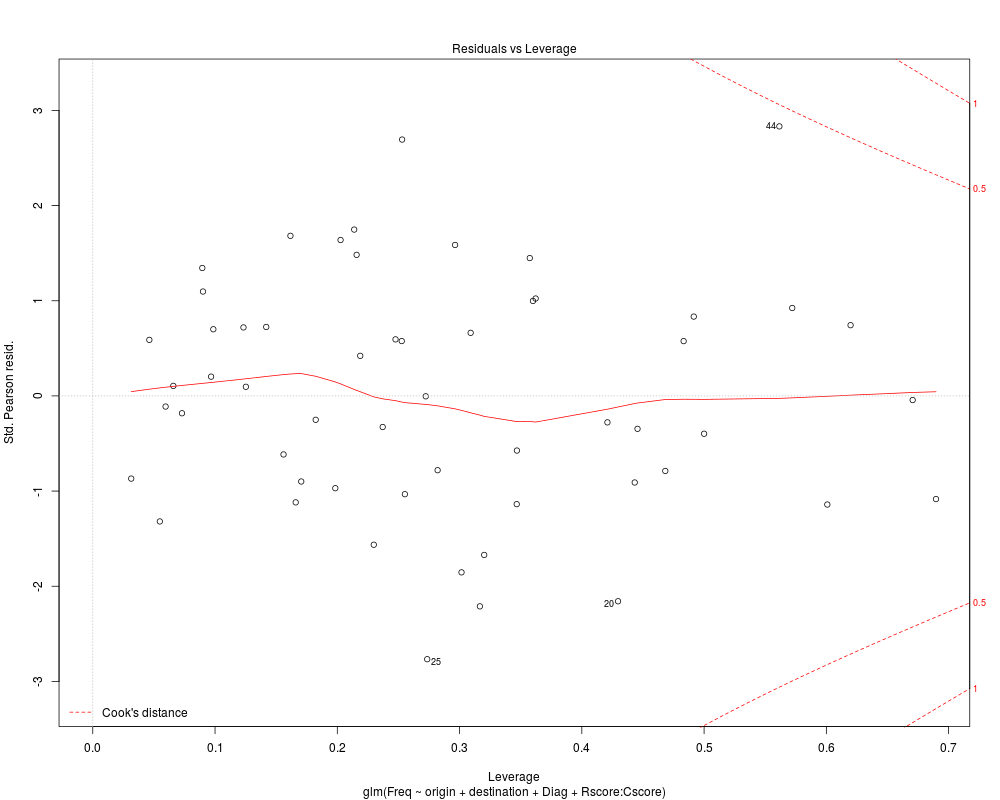
plot(modUnif) # 4 plots, with warning about h_ii ~= 1
Results
R version 3.3.1 (2016-06-21) -- "Bug in Your Hair"
Copyright (C) 2016 The R Foundation for Statistical Computing
Platform: x86_64-pc-linux-gnu (64-bit)

R is free software and comes with ABSOLUTELY NO WARRANTY.
You are welcome to redistribute it under certain conditions.
Type 'license()' or 'licence()' for distribution details.

R is a collaborative project with many contributors.
Type 'contributors()' for more information and
'citation()' on how to cite R or R packages in publications.

Type 'demo()' for some demos, 'help()' for on-line help, or
'help.start()' for an HTML browser interface to help.
Type 'q()' to quit R.

> library(datasets)
> png(filename="/home/ddbj/snapshot/RGM3/R_rel/result/datasets/occupationalStatus.Rd_%03d_medium.png", width=480, height=480)
> ### Name: occupationalStatus
> ### Title: Occupational Status of Fathers and their Sons
> ### Aliases: occupationalStatus
> ### Keywords: datasets
>
> ### ** Examples
>
> require(stats); require(graphics)
>
> plot(occupationalStatus)
>
> ##  Fit a uniform association model separating diagonal effects
> Diag <- as.factor(diag(1:8))
> Rscore <- scale(as.numeric(row(occupationalStatus)), scale = FALSE)
> Cscore <- scale(as.numeric(col(occupationalStatus)), scale = FALSE)
> modUnif <- glm(Freq ~ origin + destination + Diag + Rscore:Cscore,
+                family = poisson, data = occupationalStatus)
>
> summary(modUnif)

Call:
glm(formula = Freq ~ origin + destination + Diag + Rscore:Cscore,
    family = poisson, data = occupationalStatus)

Deviance Residuals:
    Min       1Q   Median       3Q      Max
-2.6521  -0.6267   0.0000   0.5913   2.0964

Coefficients:
              Estimate Std. Error z value Pr(>|z|)
(Intercept)   0.568592   0.183358   3.101 0.001929 **
origin2       0.431314   0.149415   2.887 0.003893 **
origin3       1.461862   0.131141  11.147  < 2e-16 ***
origin4       1.788731   0.126588  14.130  < 2e-16 ***
origin5       0.441011   0.144844   3.045 0.002329 **
origin6       2.491735   0.121219  20.556  < 2e-16 ***
origin7       1.127536   0.129032   8.738  < 2e-16 ***
origin8       0.796445   0.131863   6.040 1.54e-09 ***
destination2  0.873202   0.166902   5.232 1.68e-07 ***
destination3  1.813992   0.153861  11.790  < 2e-16 ***
destination4  2.082515   0.150887  13.802  < 2e-16 ***
destination5  1.366383   0.155590   8.782  < 2e-16 ***
destination6  2.816369   0.146054  19.283  < 2e-16 ***
destination7  1.903918   0.147810  12.881  < 2e-16 ***
destination8  1.398585   0.151658   9.222  < 2e-16 ***
Diag1         1.665495   0.237383   7.016 2.28e-12 ***
Diag2         0.959681   0.212122   4.524 6.06e-06 ***
Diag3         0.021750   0.156530   0.139 0.889490
Diag4         0.226399   0.124364   1.820 0.068689 .
Diag5         0.808646   0.229754   3.520 0.000432 ***
Diag6         0.132277   0.077191   1.714 0.086597 .
Diag7         0.506709   0.115936   4.371 1.24e-05 ***
Diag8         0.221880   0.134803   1.646 0.099771 .
Rscore:Cscore 0.136974   0.007489  18.289  < 2e-16 ***
---
Signif. codes:  0 '***' 0.001 '**' 0.01 '*' 0.05 '.' 0.1 ' ' 1

(Dispersion parameter for poisson family taken to be 1)

    Null deviance: 4679.004  on 63  degrees of freedom
Residual deviance:   58.436  on 40  degrees of freedom
AIC: 428.78

Number of Fisher Scoring iterations: 4

> plot(modUnif) # 4 plots, with warning about  h_ii ~= 1
Warning messages:
1: not plotting observations with leverage one:
  1, 10, 19, 28, 37, 46, 55, 64
2: not plotting observations with leverage one:
  1, 10, 19, 28, 37, 46, 55, 64
>
>
>
>
>
> dev.off()
null device
          1
>
|
Created & Maintained by Osamu Ogasawara (osamu.ogasawara@gmail.com) and 