Supported by Dr. Osamu Ogasawara and  . . |
|
Last data update: 2014.03.03 |
Swiss Fertility and Socioeconomic Indicators (1888) DataDescriptionStandardized fertility measure and socio-economic indicators for each of 47 French-speaking provinces of Switzerland at about 1888. Usageswiss FormatA data frame with 47 observations on 6 variables, each of which is in percent, i.e., in [0, 100].
All variables but ‘Fertility’ give proportions of the population. Details(paraphrasing Mosteller and Tukey): Switzerland, in 1888, was entering a period known as the demographic transition; i.e., its fertility was beginning to fall from the high level typical of underdeveloped countries. The data collected are for 47 French-speaking “provinces” at about 1888. Here, all variables are scaled to [0, 100], where in the
original, all but NoteFiles for all 182 districts in 1888 and other years have been available at https://opr.princeton.edu/archive/pefp/switz.aspx. They state that variables SourceProject “16P5”, pages 549–551 in Mosteller, F. and Tukey, J. W. (1977) Data Analysis and Regression: A Second Course in Statistics. Addison-Wesley, Reading Mass. indicating their source as “Data used by permission of Franice van de Walle. Office of Population Research, Princeton University, 1976. Unpublished data assembled under NICHD contract number No 1-HD-O-2077.” ReferencesBecker, R. A., Chambers, J. M. and Wilks, A. R. (1988) The New S Language. Wadsworth & Brooks/Cole. Examples
require(stats); require(graphics)
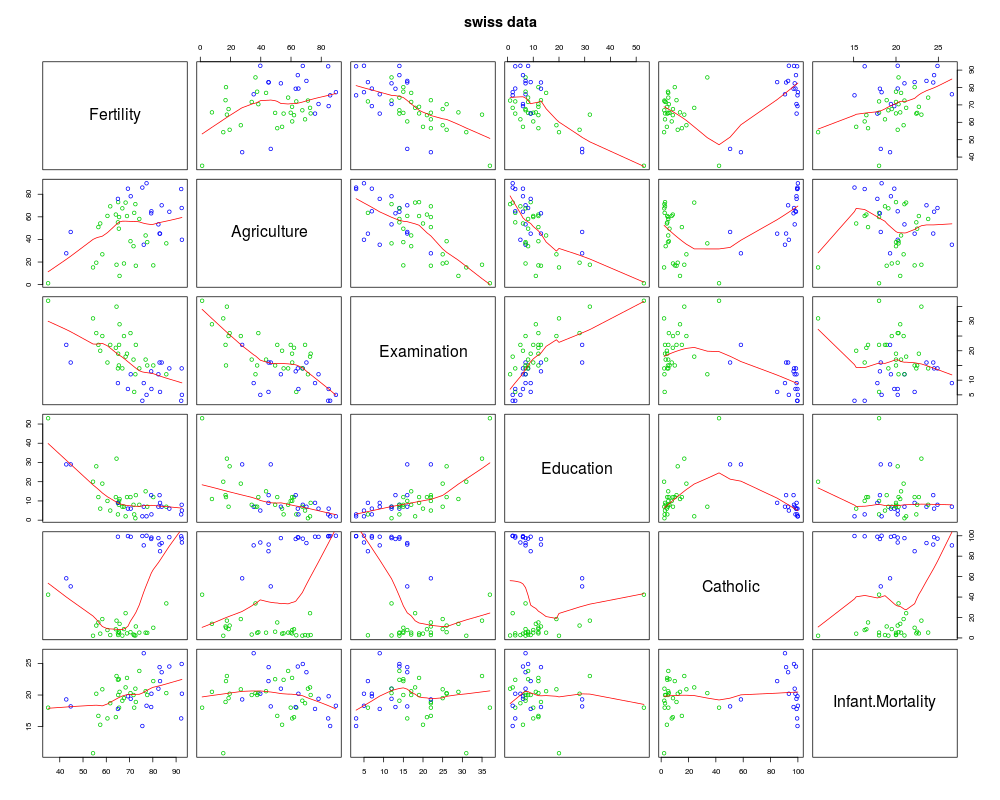
pairs(swiss, panel = panel.smooth, main = "swiss data",
col = 3 + (swiss$Catholic > 50))
summary(lm(Fertility ~ . , data = swiss))
Results
R version 3.3.1 (2016-06-21) -- "Bug in Your Hair"
Copyright (C) 2016 The R Foundation for Statistical Computing
Platform: x86_64-pc-linux-gnu (64-bit)

R is free software and comes with ABSOLUTELY NO WARRANTY.
You are welcome to redistribute it under certain conditions.
Type 'license()' or 'licence()' for distribution details.

R is a collaborative project with many contributors.
Type 'contributors()' for more information and
'citation()' on how to cite R or R packages in publications.

Type 'demo()' for some demos, 'help()' for on-line help, or
'help.start()' for an HTML browser interface to help.
Type 'q()' to quit R.

> library(datasets)
> png(filename="/home/ddbj/snapshot/RGM3/R_rel/result/datasets/swiss.Rd_%03d_medium.png", width=480, height=480)
> ### Name: swiss
> ### Title: Swiss Fertility and Socioeconomic Indicators (1888) Data
> ### Aliases: swiss
> ### Keywords: datasets
>
> ### ** Examples
>
> require(stats); require(graphics)
> pairs(swiss, panel = panel.smooth, main = "swiss data",
+       col = 3 + (swiss$Catholic > 50))
> summary(lm(Fertility ~ . , data = swiss))

Call:
lm(formula = Fertility ~ ., data = swiss)

Residuals:
     Min       1Q   Median       3Q      Max
-15.2743  -5.2617   0.5032   4.1198  15.3213

Coefficients:
                 Estimate Std. Error t value Pr(>|t|)
(Intercept)      66.91518   10.70604   6.250 1.91e-07 ***
Agriculture      -0.17211    0.07030  -2.448  0.01873 *
Examination      -0.25801    0.25388  -1.016  0.31546
Education        -0.87094    0.18303  -4.758 2.43e-05 ***
Catholic          0.10412    0.03526   2.953  0.00519 **
Infant.Mortality  1.07705    0.38172   2.822  0.00734 **
---
Signif. codes:  0 '***' 0.001 '**' 0.01 '*' 0.05 '.' 0.1 ' ' 1

Residual standard error: 7.165 on 41 degrees of freedom
Multiple R-squared:  0.7067,	Adjusted R-squared:  0.671
F-statistic: 19.76 on 5 and 41 DF,  p-value: 5.594e-10

>
>
>
>
>
> dev.off()
null device
          1
>
|