Supported by Dr. Osamu Ogasawara and  . . |
|
Last data update: 2014.03.03 |
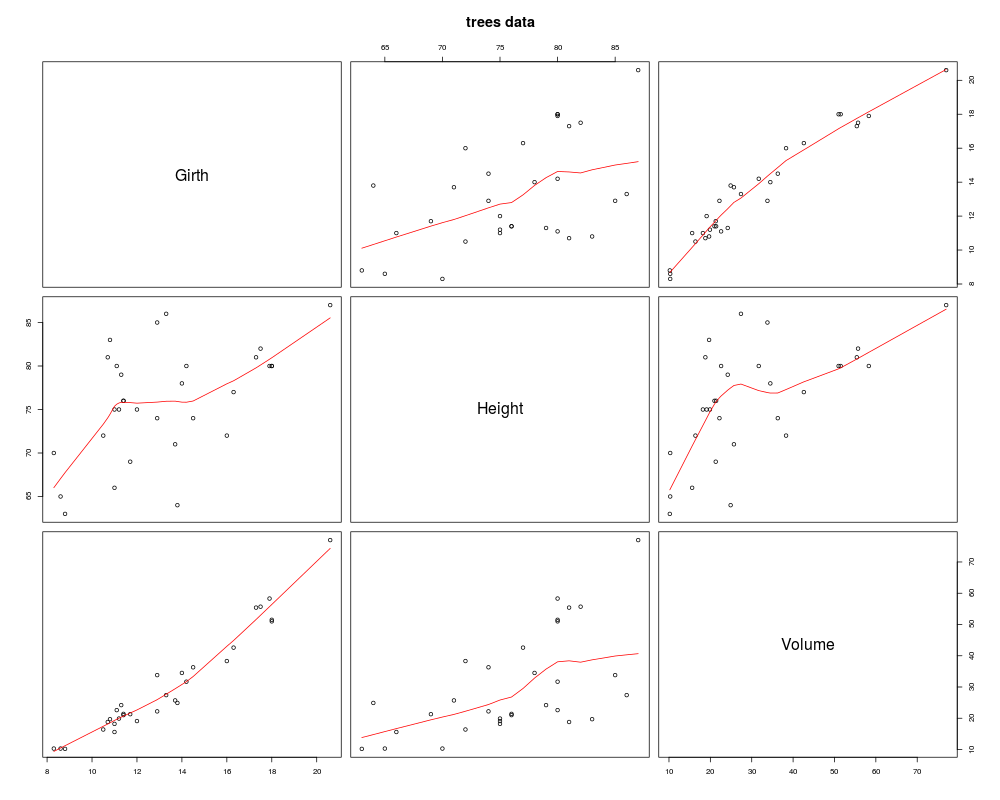
Girth, Height and Volume for Black Cherry TreesDescriptionThis data set provides measurements of the girth, height and volume of timber in 31 felled black cherry trees. Note that girth is the diameter of the tree (in inches) measured at 4 ft 6 in above the ground. Usagetrees FormatA data frame with 31 observations on 3 variables.
SourceRyan, T. A., Joiner, B. L. and Ryan, B. F. (1976) The Minitab Student Handbook. Duxbury Press. ReferencesAtkinson, A. C. (1985) Plots, Transformations and Regression. Oxford University Press. Examples
require(stats); require(graphics)
pairs(trees, panel = panel.smooth, main = "trees data")
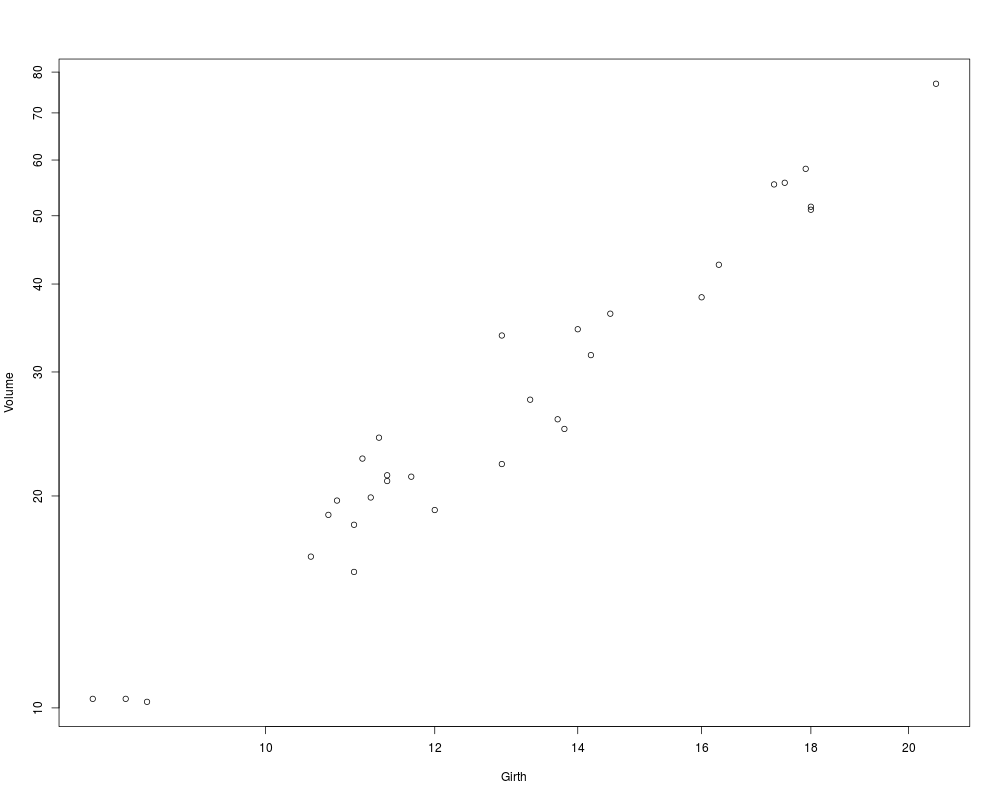
plot(Volume ~ Girth, data = trees, log = "xy")
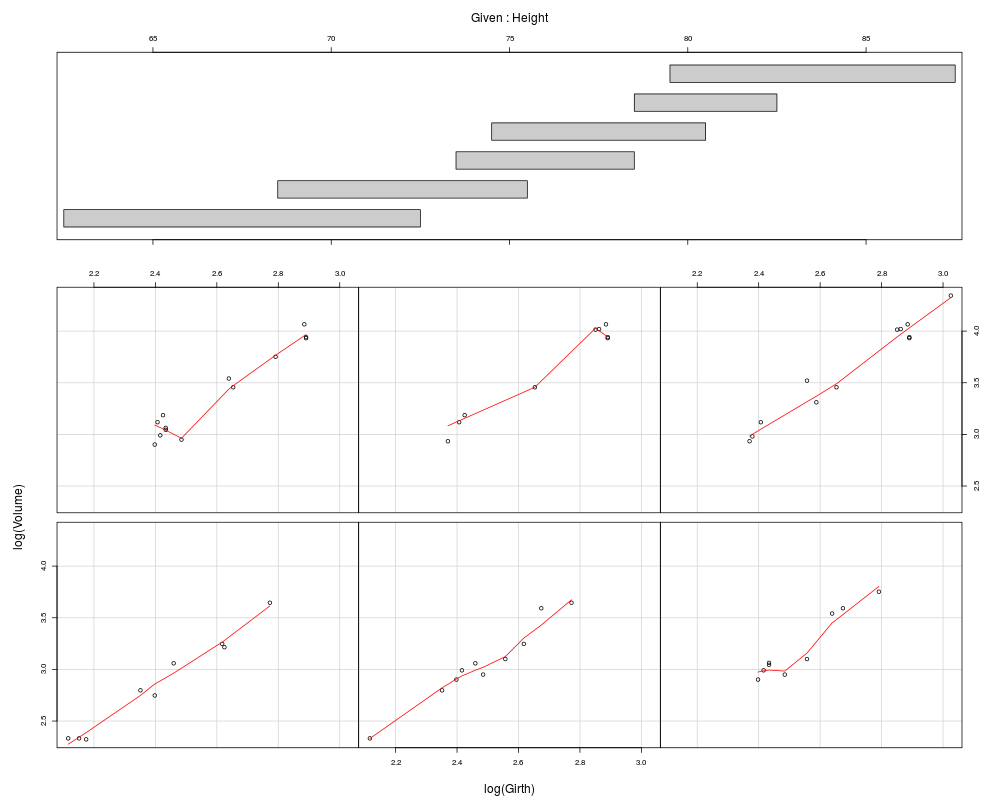
coplot(log(Volume) ~ log(Girth) | Height, data = trees,
panel = panel.smooth)
summary(fm1 <- lm(log(Volume) ~ log(Girth), data = trees))
summary(fm2 <- update(fm1, ~ . + log(Height), data = trees))
step(fm2)
## i.e., Volume ~= c * Height * Girth^2 seems reasonable
Results
R version 3.3.1 (2016-06-21) -- "Bug in Your Hair"
Copyright (C) 2016 The R Foundation for Statistical Computing
Platform: x86_64-pc-linux-gnu (64-bit)

R is free software and comes with ABSOLUTELY NO WARRANTY.
You are welcome to redistribute it under certain conditions.
Type 'license()' or 'licence()' for distribution details.

R is a collaborative project with many contributors.
Type 'contributors()' for more information and
'citation()' on how to cite R or R packages in publications.

Type 'demo()' for some demos, 'help()' for on-line help, or
'help.start()' for an HTML browser interface to help.
Type 'q()' to quit R.

> library(datasets)
> png(filename="/home/ddbj/snapshot/RGM3/R_rel/result/datasets/trees.Rd_%03d_medium.png", width=480, height=480)
> ### Name: trees
> ### Title: Girth, Height and Volume for Black Cherry Trees
> ### Aliases: trees
> ### Keywords: datasets
>
> ### ** Examples
>
> require(stats); require(graphics)
> pairs(trees, panel = panel.smooth, main = "trees data")
> plot(Volume ~ Girth, data = trees, log = "xy")
> coplot(log(Volume) ~ log(Girth) | Height, data = trees,
+        panel = panel.smooth)
> summary(fm1 <- lm(log(Volume) ~ log(Girth), data = trees))

Call:
lm(formula = log(Volume) ~ log(Girth), data = trees)

Residuals:
      Min        1Q    Median        3Q       Max
-0.205999 -0.068702  0.001011  0.072585  0.247963

Coefficients:
            Estimate Std. Error t value Pr(>|t|)
(Intercept) -2.35332    0.23066  -10.20 4.18e-11 ***
log(Girth)   2.19997    0.08983   24.49  < 2e-16 ***
---
Signif. codes:  0 '***' 0.001 '**' 0.01 '*' 0.05 '.' 0.1 ' ' 1

Residual standard error: 0.115 on 29 degrees of freedom
Multiple R-squared:  0.9539,	Adjusted R-squared:  0.9523
F-statistic: 599.7 on 1 and 29 DF,  p-value: < 2.2e-16

> summary(fm2 <- update(fm1, ~ . + log(Height), data = trees))

Call:
lm(formula = log(Volume) ~ log(Girth) + log(Height), data = trees)

Residuals:
      Min        1Q    Median        3Q       Max
-0.168561 -0.048488  0.002431  0.063637  0.129223

Coefficients:
            Estimate Std. Error t value Pr(>|t|)
(Intercept) -6.63162    0.79979  -8.292 5.06e-09 ***
log(Girth)   1.98265    0.07501  26.432  < 2e-16 ***
log(Height)  1.11712    0.20444   5.464 7.81e-06 ***
---
Signif. codes:  0 '***' 0.001 '**' 0.01 '*' 0.05 '.' 0.1 ' ' 1

Residual standard error: 0.08139 on 28 degrees of freedom
Multiple R-squared:  0.9777,	Adjusted R-squared:  0.9761
F-statistic: 613.2 on 2 and 28 DF,  p-value: < 2.2e-16

> step(fm2)
Start:  AIC=-152.69
log(Volume) ~ log(Girth) + log(Height)

              Df Sum of Sq    RSS      AIC
<none>                     0.1855 -152.685
- log(Height)  1    0.1978 0.3832 -132.185
- log(Girth)   1    4.6275 4.8130  -53.743

Call:
lm(formula = log(Volume) ~ log(Girth) + log(Height), data = trees)

Coefficients:
(Intercept)   log(Girth)  log(Height)
     -6.632        1.983        1.117

> ## i.e., Volume ~= c * Height * Girth^2  seems reasonable
>
>
>
>
>
> dev.off()
null device
          1
>
|
Created & Maintained by Osamu Ogasawara (osamu.ogasawara@gmail.com) and 