Supported by Dr. Osamu Ogasawara and  . . |
|
Last data update: 2014.03.03 |
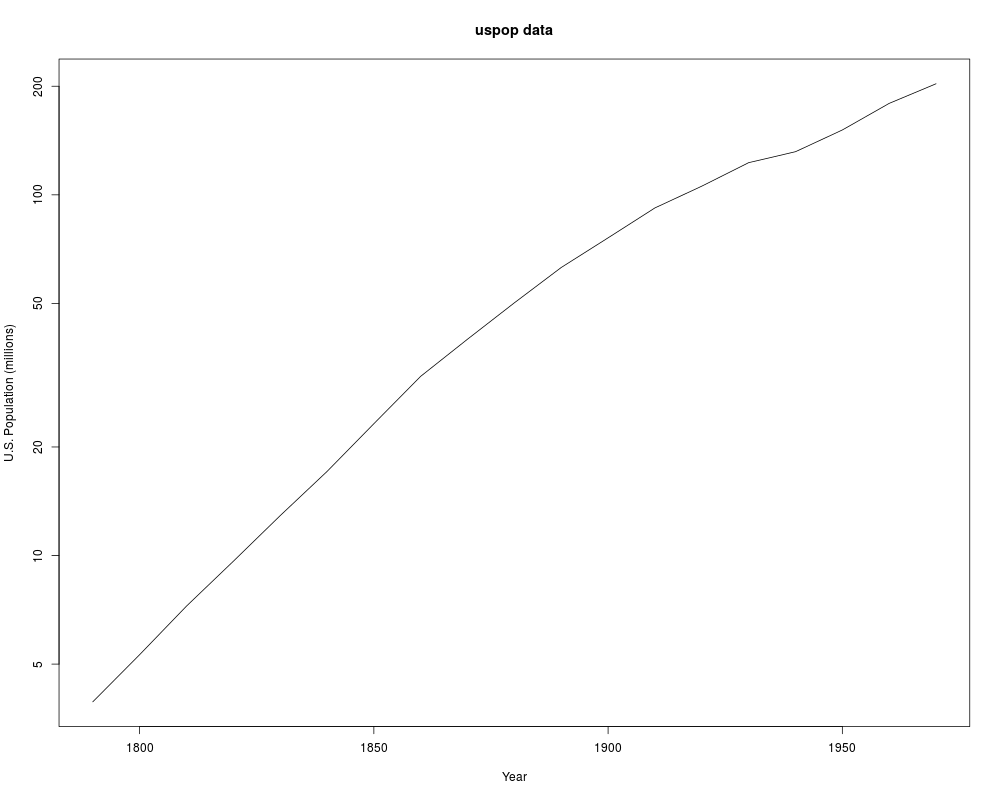
Populations Recorded by the US CensusDescriptionThis data set gives the population of the United States (in millions) as recorded by the decennial census for the period 1790–1970. Usageuspop FormatA time series of 19 values. SourceMcNeil, D. R. (1977) Interactive Data Analysis. New York: Wiley. Examples
require(graphics)
plot(uspop, log = "y", main = "uspop data", xlab = "Year",
     ylab = "U.S. Population (millions)")
Results
R version 3.3.1 (2016-06-21) -- "Bug in Your Hair"
Copyright (C) 2016 The R Foundation for Statistical Computing
Platform: x86_64-pc-linux-gnu (64-bit)

R is free software and comes with ABSOLUTELY NO WARRANTY.
You are welcome to redistribute it under certain conditions.
Type 'license()' or 'licence()' for distribution details.

R is a collaborative project with many contributors.
Type 'contributors()' for more information and
'citation()' on how to cite R or R packages in publications.

Type 'demo()' for some demos, 'help()' for on-line help, or
'help.start()' for an HTML browser interface to help.
Type 'q()' to quit R.

> library(datasets)
> png(filename="/home/ddbj/snapshot/RGM3/R_rel/result/datasets/uspop.Rd_%03d_medium.png", width=480, height=480)
> ### Name: uspop
> ### Title: Populations Recorded by the US Census
> ### Aliases: uspop
> ### Keywords: datasets
>
> ### ** Examples
>
> require(graphics)
> plot(uspop, log = "y", main = "uspop data", xlab = "Year",
+      ylab = "U.S. Population (millions)")
>
>
>
>
>
> dev.off()
null device
          1
>
|
Created & Maintained by Osamu Ogasawara (osamu.ogasawara@gmail.com) and 